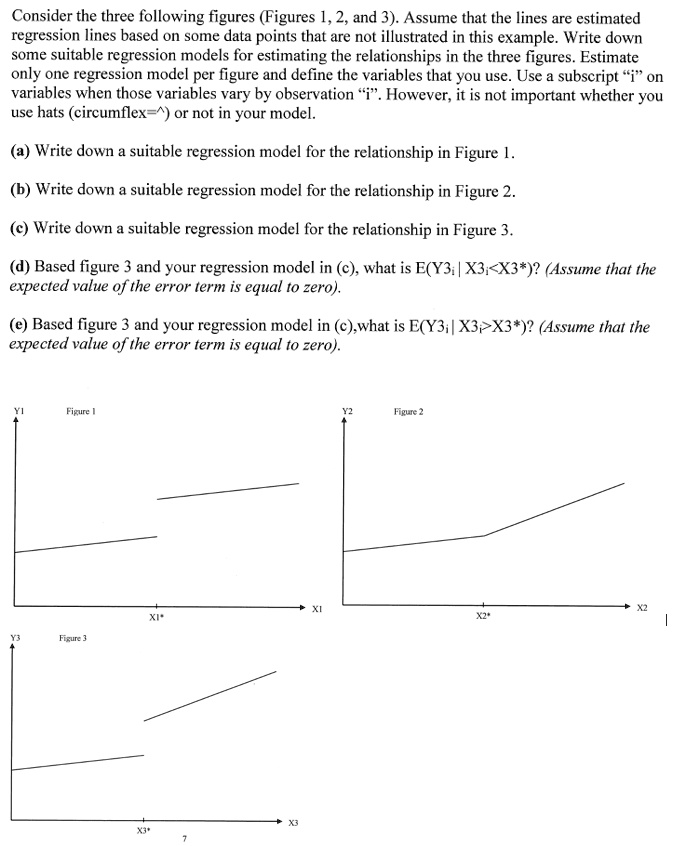
Consider the three following figures (Figures 1, 2, and 3). Assume that the lines are estimated regression lines based on some data points that are not illustrated in this example. Write down some suitable regression models for estimating the relationships in the three figures. Estimate only one regression model per figure and define the variables that you use. Use a subscript "i" on variables when those variables vary by observation "i". However, it is not important whether you use hats (circumflex=^) or not in your model.
(a) Write down a suitable regression model for the relationship in Figure 1.
(b) Write down a suitable regression model for the relationship in Figure 2.
(c) Write down a suitable regression model for the relationship in Figure 3.
(d) Based figure 3 and your regression model in (c), what is E(Y3 | X3<X3*)? (Assume that the expected value of the error term is equal to zero).
(e) Based figure 3 and your regression model in (c), what is E(Y3i | X3>X3*)? (Assume that the expected value of the error term is equal to zero).