The following is a set of data from a sample of n = 5.
9 -3 -6 9 11
a. Compute the first quartile ($Q_1$), the third quartile ($Q_3$), and the interquartile range.
b. List the five-number summary.
c. Construct a boxplot and describe the shape.
a. The first quartile is
The third quartile is .
The interquartile range is
b. The five-number summary is ?.????. (Use ascending order.)
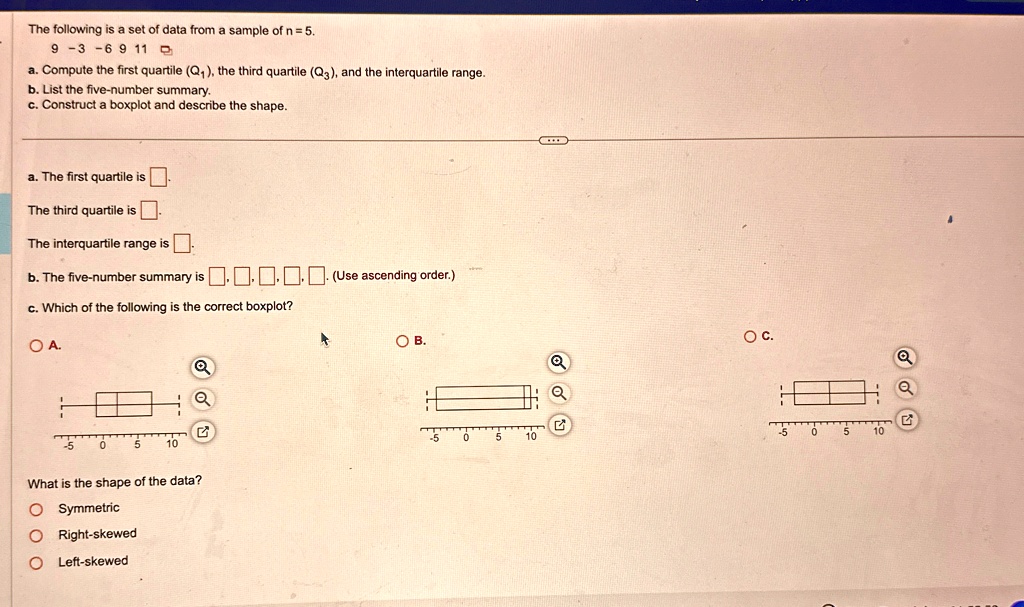
c. Which of the following is the correct boxplot?
OA.
OB.
OC.
What is the shape of the data?
O Symmetric
O Right-skewed
O Left-skewed