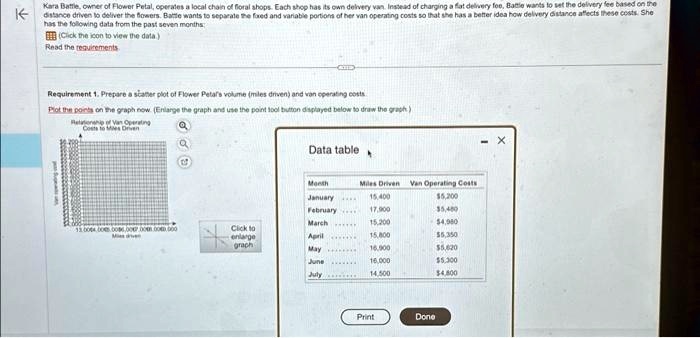
Kara Battle, owner of Flower Petal, operates a local chain of floral shops. Each shop has its own delivery van. Instead of charging a flat delivery foe, Battle wants to set the delivery fee based on the
distance driven to deliver the flowers. Battle wants to separate the fixed and variable portions of her van operating costs so that she has a better idea how delivery distance affects these costs. She
has the following data from the past seven months:
(Click the icon to view the data)
Read the requirements
Requirement 1. Prepare a scatter plot of Flower Petal's volume (miles driven) and van operating costs.
Plot the points on the graph now. (Enlarge the graph and use the point tool button displayed below to draw the graph)
Relationship of Van Operating
Costs to Miles Driven
Data table
Month Miles Driven Van Operating Costs
January 15,400 $5,200
February 17,900 $5,480
March 15,200 $4,980
April 15,800 $5,350
May 16,900 $5,620
June 16,000 $5,300
July 14,500 $4,800
Print Done