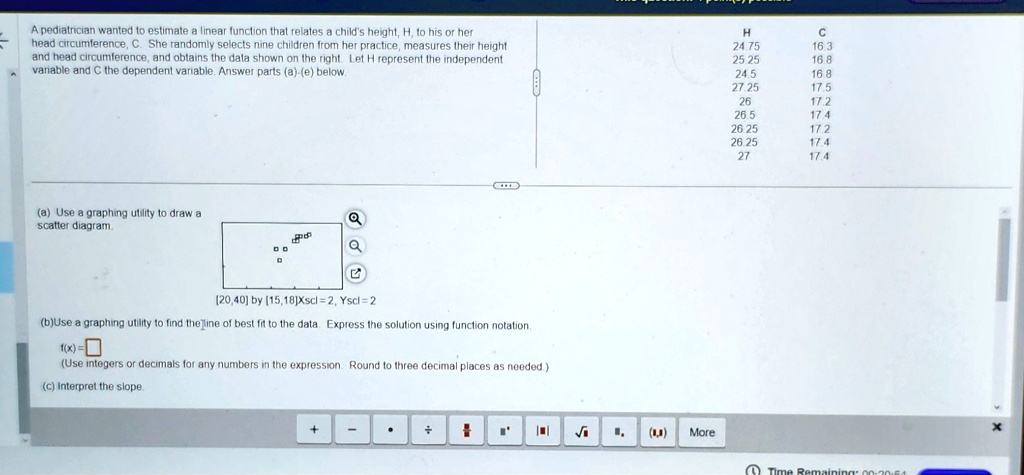
A pediatrician wanted to estimate a linear function that relates a child's height, H, to his or her head circumference, C. She randomly selects nine children from her practice, measures their height and head circumference, and obtains the data shown on the right. Let H represent the independent variable and C the dependent variable. Answer parts (a)-(e) below.
H 24.75 25.25 24.5 27.25 26 26.5 26.25 26.25 27
C 16.3 16.8 16.8 17.5 17.2 17.4 17.2 17.4 17.4
a Use a graphing utility to draw a scatter diagram. [20,40] by [15,18] Xscl=2, Yscl=2
b Use a graphing utility to find the line of best fit to the data. Express the solution using function notation f(x). Use integers or decimals for any numbers in the expression. Round to three decimal places as needed.
c Interpret the slope.