Learning Goal:
To recognize various types of processes on pV^(2) diagrams and to understand the relationship between pV-diagram geometry and the quantities Q, W, and ΔE_(th).
The first law of thermodynamics is an expression of conservation of energy. This law states that changes in the internal energy of a system ΔE_(th) can be explained in terms of energy transfer into or out of the system in the form of heat Q and/or work W.
ΔE_(th) = W + Q
In this problem, we will write the first law of thermodynamics as
ΔE_(th) = W_(on) + W_(by) + Q_(in) + Q_(out).
Here "in" means that energy is being transferred into the system by atomic-level collisions, thereby raising its internal energy (Q) > 0, and "out" means that energy is leaving the system, thereby reducing its internal energy (Q) < 0. "On" means that energy is being transferred into the system by forces in a mechanical interaction, thereby raising the internal energy (W) > 0, and "by" means that energy is leaving the system, thereby reducing the internal energy (W < 0). You will determine the sizes of these energy transfers and classify their effect on the system as energy in or energy out.
Consider a system consisting of an ideal gas confined within a container, one wall of which is a movable piston. Energy can be added to the gas in the form of heat by applying a flame to the outside of the container. Conversely, energy can also be removed from the gas in the form of heat by immersing the container in ice water. Energy can be added to the system in the form of work by pushing the piston in, thereby compressing the gas. Conversely, if the gas pushes the piston out, thereby pushing some atmosphere aside, the internal energy of the gas is reduced by the amount of work done.
The internal energy of an ideal gas is directly proportional to its absolute temperature T. An ideal gas also obeys the ideal gas law
pV = nRT,
so the absolute temperature T is directly proportional to the product of the absolute pressure p and the volume V. Here n denotes the amount of gas in moles, which is a constant because the gas is confined, and R is the universal gas constant.
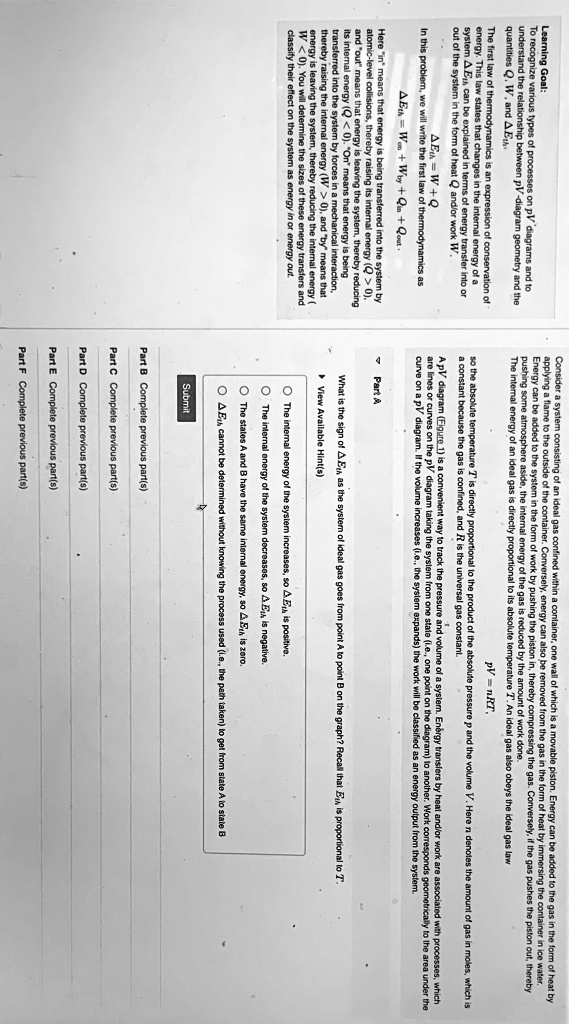
A pV diagram (Figure 1) is a convenient way to track the pressure and volume of a system. Energy transfers by heat and/or work are associated with processes, which are lines or curves on the pV diagram taking the system from one state (i.e., one point on the diagram) to another. Work corresponds geometrically to the area under the curve on a pV diagram. If the volume increases (i.e., the system expands) the work will be classified as an energy output from the system.
Part A
What is the sign of ΔE_(th) as the system of ideal gas goes from point A to point B on the graph? Recall that E_(th) is proportional to T.