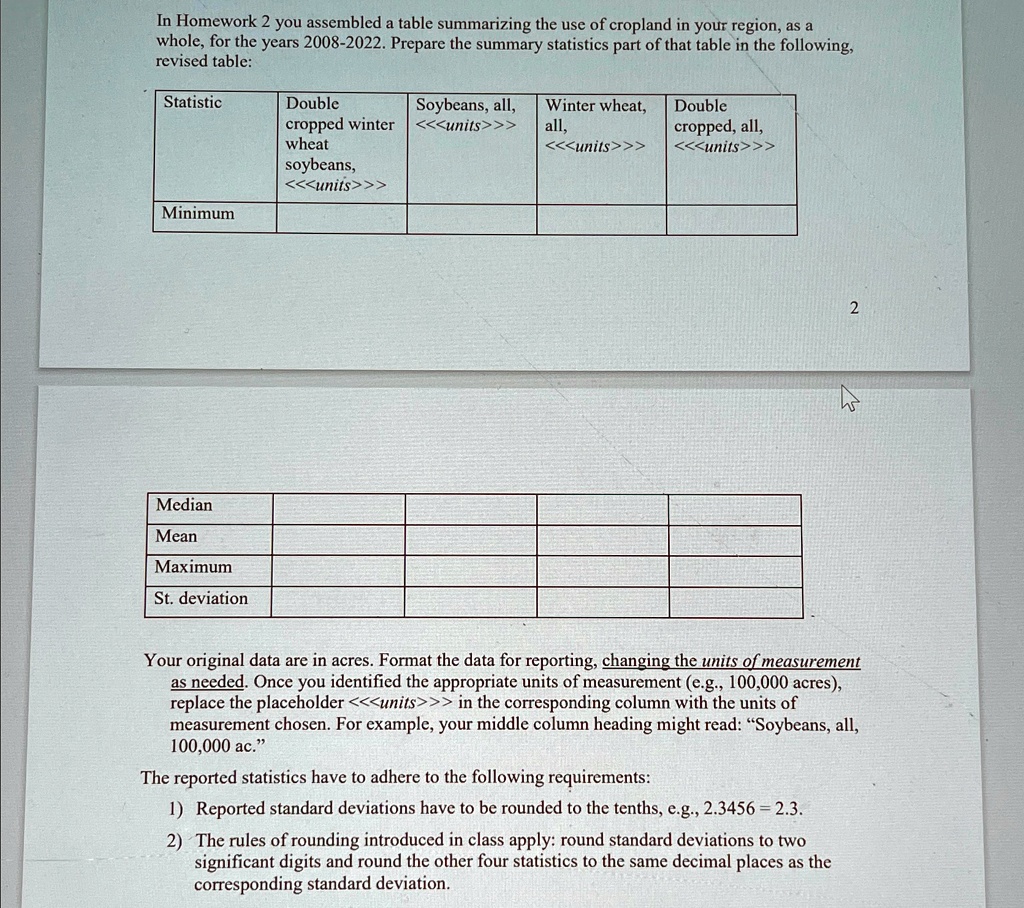
In Homework 2 you assembled a table summarizing the use of cropland in your region, as a whole, for the years 2008-2022. Prepare the summary statistics part of that table in the following, revised table:
able[[Statistic, able[[Double],[cropped winter],[wheat],[soybeans,],[<<< units >>>
In Homework 2 you assembled a table summarizing the use of cropland in your region,as a whole, for the years 2008-2022. Prepare the summary statistics part of that table in the following, revised table:
Statistic
Double Soybeans, all, cropped winter <<<units>>> wheat soybeans, <<<units>>
Winter wheat, all, <<<units>>>
Double cropped, all, <<<units>>
Minimum
2
Median
Mean
Maximum St.deviation
Your original data are in acres. Format the data for reporting, changing the units of measurement as needed. Once you identified the appropriate units of measurement (e.g., 100,000 acres), replace the placeholder <<<units>>> in the corresponding column with the units of measurement chosen.For example,your middle column heading might read:"Soybeans,all, 100,000ac.
The reported statistics have to adhere to the following requirements: 1)Reported standard deviations have to be rounded to the tenths, e.g., 2.3456 =2.3. 2) The rules of rounding introduced in class apply: round standard deviations to two significant digits and round the other four statistics to the same decimal places as the corresponding standard deviation.