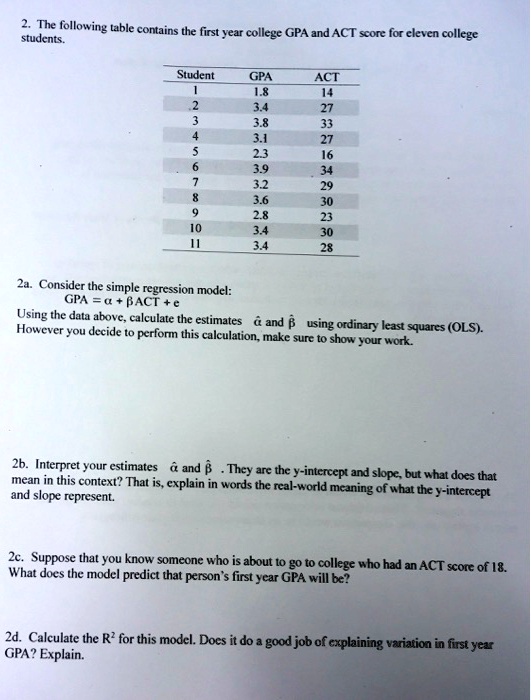
2. The following table contains the first year college GPA and ACT score for eleven college students.
Student GPA ACT
1 1.8 14
2 3.4 27
3 3.8 33
4 3.1 27
5 2.3 16
6 3.9 34
7 3.2 29
8 3.6 30
9 2.8 23
10 3.4 30
11 3.4 28
2a. Consider the simple regression model:
GPA = \alpha + \beta ACT + e
Using the data above, calculate the estimates \hat{\alpha} and \hat{\beta} using ordinary least squares (OLS).
However you decide to perform this calculation, make sure to show your work.
2b. Interpret your estimates \hat{\alpha} and \hat{\beta}. They are the y-intercept and slope, but what does that
mean in this context? That is, explain in words the real-world meaning of what the y-intercept
and slope represent.
2c. Suppose that you know someone who is about to go to college who had an ACT score of 18.
What does the model predict that person's first year GPA will be?
2d. Calculate the R$^2$ for this model. Does it do a good job of explaining variation in first year
GPA? Explain.