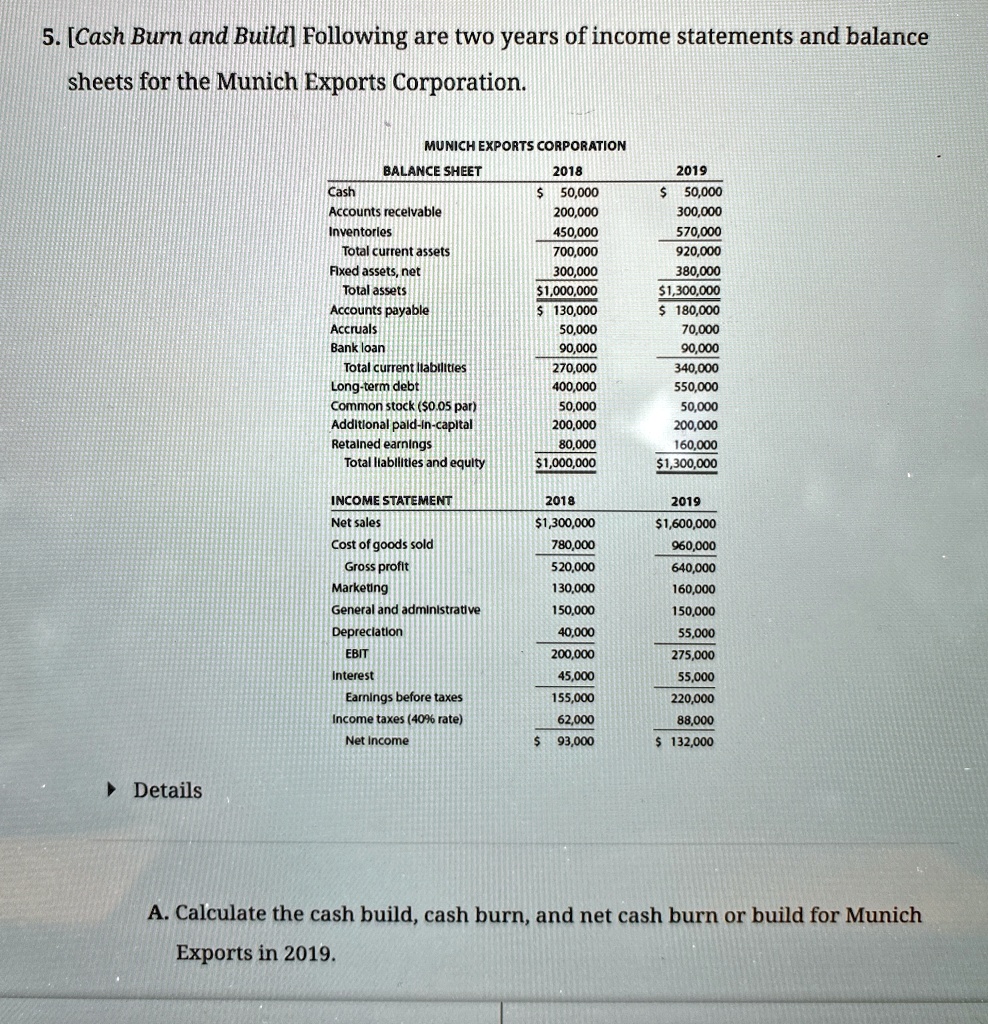
5. [Cash Burn and Build] Following are two years of income statements and balance
sheets for the Munich Exports Corporation.
MUNICH EXPORTS CORPORATION
BALANCE SHEET
2018
2019
Cash
$ 50,000
$ 50,000
Accounts receivable
200,000
300,000
Inventories
450,000
570,000
Total current assets
700,000
920,000
Fixed assets, net
300,000
380,000
Total assets
$1,000,000
$1,300,000
Accounts payable
$ 130,000
$ 180,000
Accruals
50,000
70,000
Bank loan
90,000
90,000
Total current liabilities
270,000
340,000
Long-term debt
400,000
550,000
Common stock ($0.05 par)
50,000
50,000
Additional paid-in-capital
200,000
200,000
Retained earnings
80,000
160,000
Total liabilities and equity
$1,000,000
$1,300,000
INCOME STATEMENT
2018
2019
Net sales
$1,300,000
$1,600,000
Cost of goods sold
780,000
960,000
Gross profit
520,000
640,000
Marketing
130,000
160,000
General and administrative
150,000
150,000
Depreciation
40,000
55,000
EBIT
200,000
275,000
Interest
45,000
55,000
Earnings before taxes
155,000
220,000
Income taxes (40% rate)
62,000
88,000
Net income
$ 93,000
$ 132,000
▸ Details
A. Calculate the cash build, cash burn, and net cash burn or build for Munich
Exports in 2019.