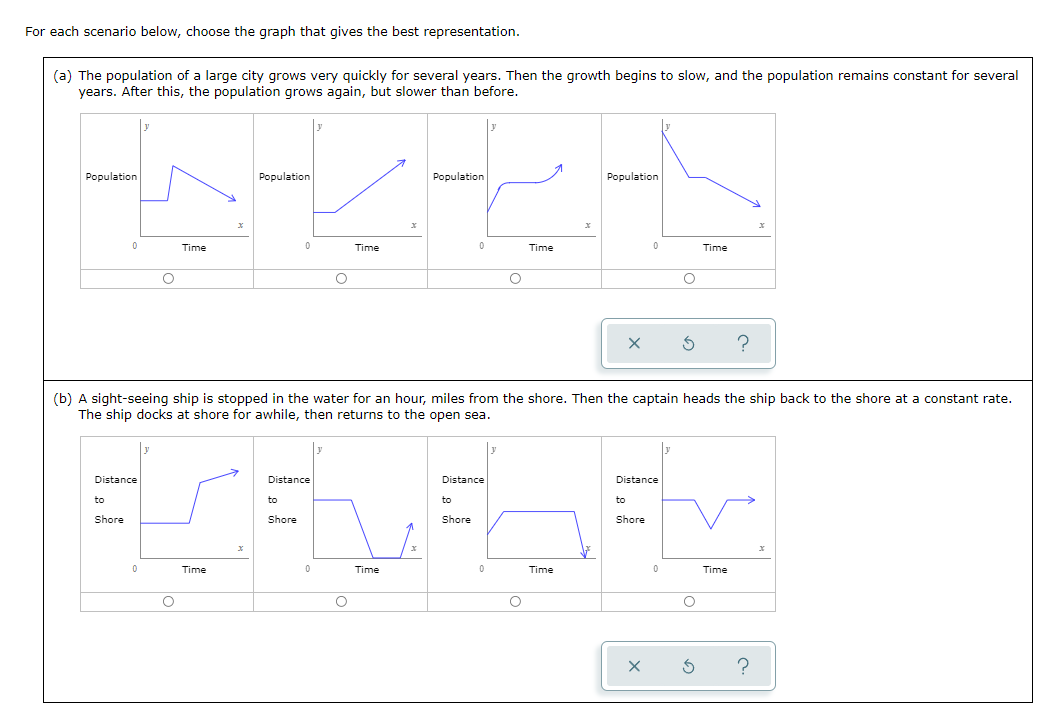
For each scenario below, choose the graph that gives the best representation.
(a) The population of a large city grows very quickly for several years. Then the growth begins to slow, and the population remains constant for several years. After this, the population grows again, but slower than before.
(b) A sight-seeing ship is stopped in the water for an hour, miles from the shore. Then the captain heads the ship back to the shore at a constant rate. The ship docks at shore for awhile, then returns to the open sea.