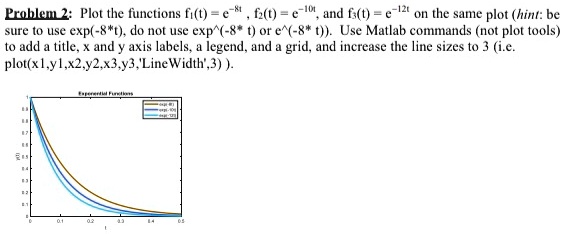
Problem 2: Plot the functions $f_1(t) = e^{-8t}$, $f_2(t) = e^{-10t}$, and $f_3(t) = e^{-12t}$ on the same plot (hint: be sure to use exp(-8*t), do not use exp^(-8* t) or e^(-8* t)). Use Matlab commands (not plot tools) to add a title, x and y axis labels, a legend, and a grid, and increase the line sizes to 3 (i.e. plot(x1,y1,x2,y2,x3,y3, 'LineWidth',3)).