A set of data has a lower quartile of 31.5 , a median of 37 , and an upper quartile of 43.5 .
a. Calculate the interquartile range for this data set.
b. Calculate the boundaries that identify outliers.
c. The smallest values of the data set are 13 and 20. The largest values are 52 and 55. Which of
these would be outliers?
d. Draw a boxplot of the data set.
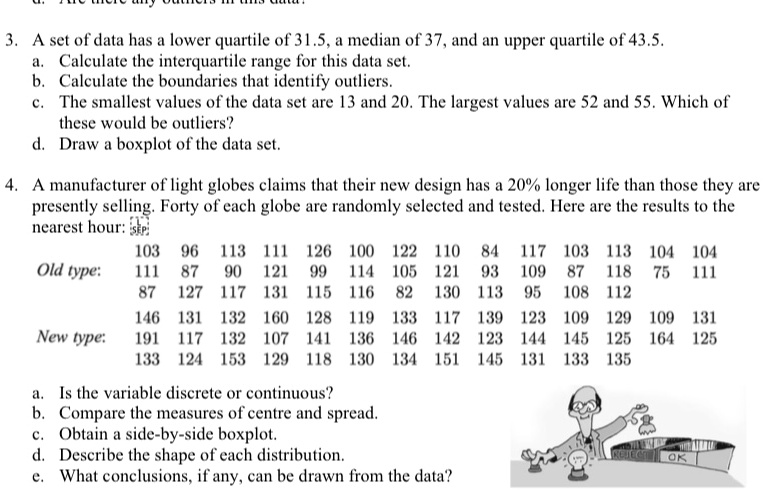
A manufacturer of light globes claims that their new design has a 20% longer life than those they are
presently selling. Forty of each globe are randomly selected and tested. Here are the results to the
nearest hour: sip?
a. Is the variable discrete or continuous?
b. Compare the measures of centre and spread.
c. Obtain a side-by-side boxplot.
d. Describe the shape of each distribution.
e. What conclusions, if any, can be drawn from the data?
3.A set of data has a lower quartile of 31.5, a median of 37, and an upper quartile of 43.5. a. Calculate the interquartile range for this data set b.Calculate the boundaries that identify outliers. c. The smallest values of the data set are 13 and 20. The largest values are 52 and 55. Which of these would be outliers? d.Draw a boxplot of the data set.
4.A manufacturer of light globes claims that their new design has a 20% longer life than those they are presently selling. Forty of each globe are randomly selected and tested. Here are the results to the nearest hour: (skp) 103 96 113 111 126 100 122 110 84 117 103 113 104 104 Old type: 111 87 90 121 99 114 105 121 93 109 87 118 75 111 87 127 117 131 115 116 82 130 113 95 108 112 146 131 132 160 128 119 133 117 139 123 109 129 109 131 New type: 191 117 132 107 141 136 146 142 123 144 145 125 164 125 133 124 153 129 118 130 134 151 145 131 133 135
a. Is the variable discrete or continuous? b. Compare the measures of centre and spread c. Obtain a side-by-side boxplot. d. Describe the shape of each distribution e. What conclusions, if any, can be drawn from the data?