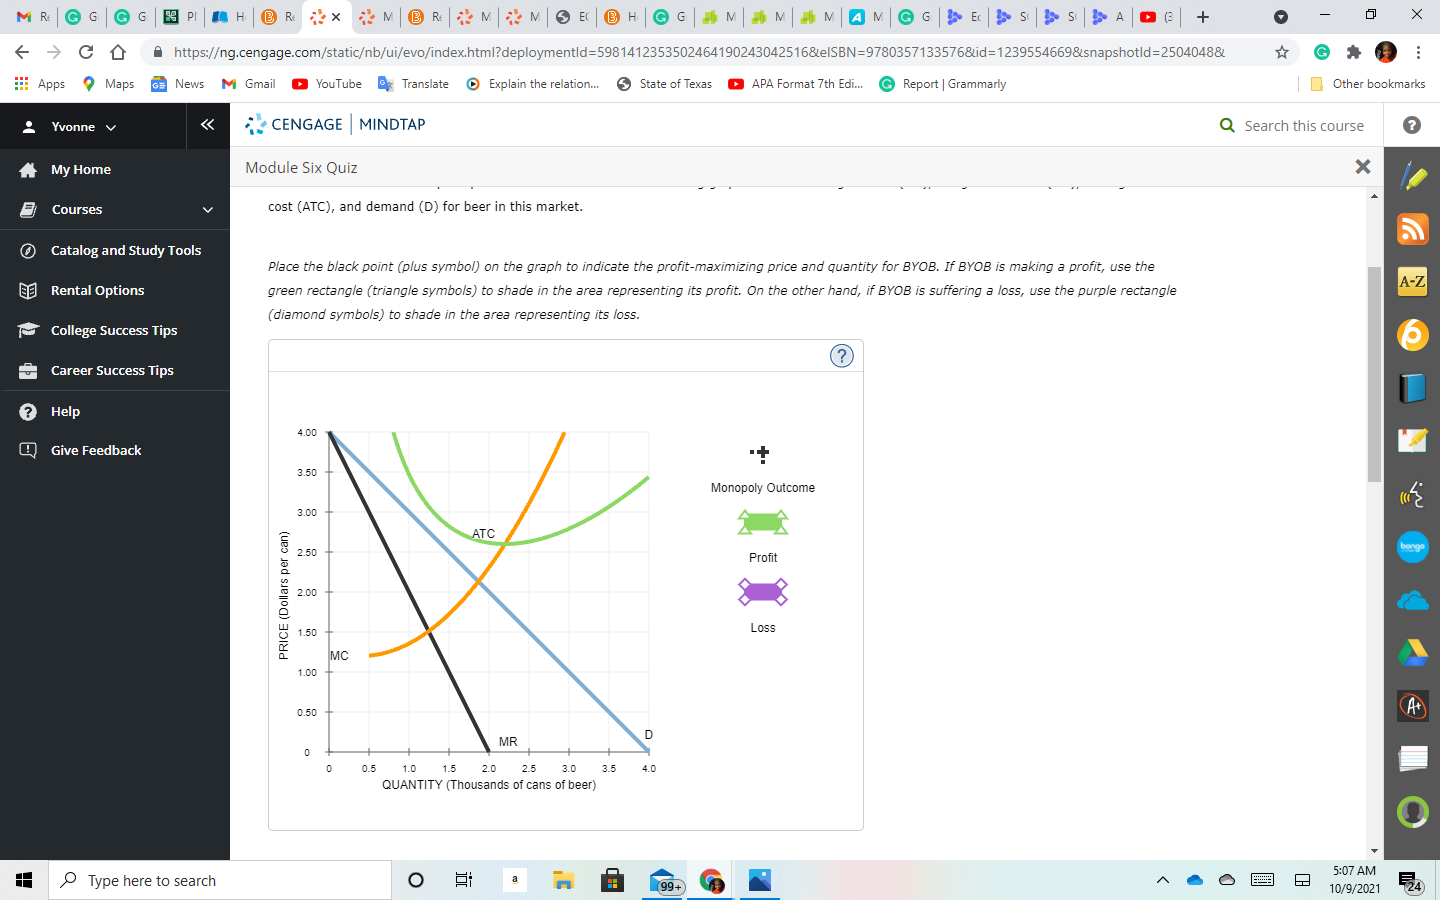
cost (ATC), and demand (D) for beer in this market.
Place the black point (plus symbol) on the graph to indicate the profit-maximizing price and quantity for BYOB. If BYOB is making a profit, use the green rectangle (triangle symbols) to shade in the area representing its profit. On the other hand, if BYOB is suffering a loss, use the purple rectangle (diamond symbols) to shade in the area representing its loss.
4.00
3.50
3.00
2.50
2.00
1.50
1.00
0.50
0
ATC
MC
MR
D
0 0.5 1.0 1.5 2.0 2.5 3.0 3.5 4.0
PRICE (Dollars per can)
QUANTITY (Thousands of cans of beer)
Monopoly Outcome
Profit
Loss