Ace - AI Tutor
Ask Our Educators
Textbooks
My Library
Flashcards
Scribe - AI Notes
Notes & Exams
Download App
ZUHAIR ABDULRAHMAN ALMALKI

ZUHAIR A.

Divider

Questions asked

ANSWERED

Ivan Kochetkov verified

Numerade educator

Part (f-5) 1 point possible (graded) Therefore, we shall: Reject our null hypothesis, emission rate appear to be not constant. Reject our null hypothesis, emission rate appear to be constant. Cannot reject our null hypothesis, emission rate appear to be not constant. Cannot reject our null hypothesis, emission rate appear to be constant. Submit

View Answer
divider
ANSWERED

Shu Naito verified

Numerade educator

Part (f-4) 2 points possible (graded) Given the observed data, the value of the test statistic is: (Please enter the value with a precision of three significant figures, your answer will be graded with a 2% tolerance.) ??(x)= Its p-value is: (Please enter the value with a precision of three significant figures, your answer will be graded with a 2% tolerance.) p= Submit You have used 0 of 2 attempts Save

View Answer
divider
ANSWERED

Shu Naito verified

Numerade educator

Part (f-3) 1 point possible (graded) Determine the rejection region at a significance level of 0.05 . (Please enter the value with a precision of three significant figures, your answer will be graded with a 2% tolerance.) The rejection region is ??(?x) ? Submit You have used 0 of 3 attempts Save

View Answer
divider
ANSWERED

Ivan Kochetkov verified

Numerade educator

Part (f-2) 1 point possible (graded) The asymptotic distribution for ( Lambda(x) ) is: ( mathcal{N}(1, sqrt{2}) ) ( chi_{1}^{2} ) ( operatorname{Binomial}(1,0.5) ) Binomial ( (100,0.99) ) ( chi_{99}^{2} ) ( chi_{100}^{2} ) ( mathcal{N}(99,10 sqrt{2}) ) ( mathcal{N}(100,10 sqrt{2}) )

View Answer
divider
ANSWERED

Luke Humphrey verified

Numerade educator

Part (f-1) 1 point possible (graded) 
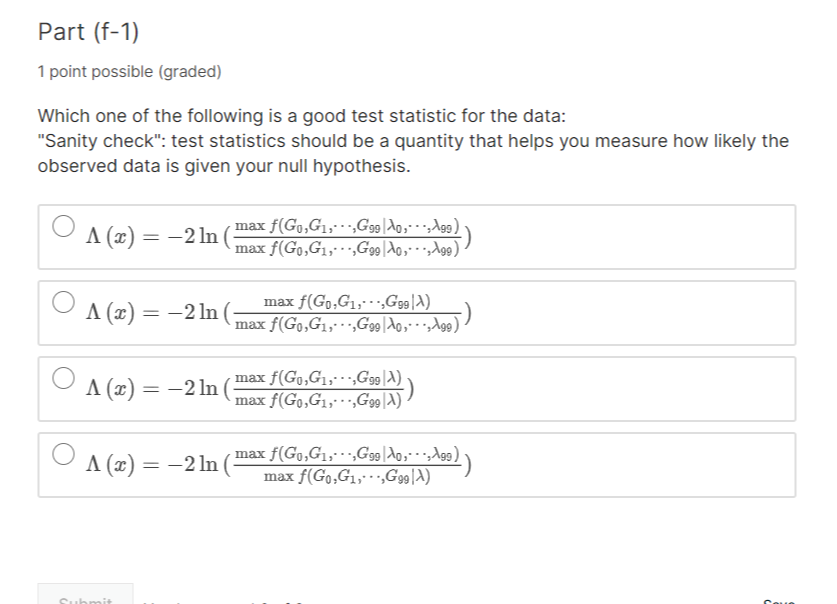
Which one of the following is a good test statistic for the data: "Sanity check": test statistics should be a quantity that helps you measure how likely the observed data is given your null hypothesis. ( Lambda(X)=-2 ln left(frac{max_{lambda} fleft(G_{0}, G_{1}, ldots, G_{99} mid lambda, ldots, lambda ight)}{max _{lambda_{0}, ldots, lambda_{99}} fleft(G_{0}, G_{1}, ldots, G_{99} mid lambda_{0}, ldots, lambda_{99} ight)} ight) ) ( Lambda(X)=-2 ln left(frac{max _{lambda} fleft(G_{0}, G_{1}, ldots, G_{99} mid lambda, ldots, lambda ight)}{max _{lambda_{0}, ldots, lambda_{99}} fleft(G_{0}, G_{1}, ldots, G_{99} mid lambda_{0}, ldots, lambda_{99} ight)} ight) ) ( Lambda(X)=-2 ln left(frac{max _{lambda} fleft(G_{0}, G_{1}, ldots, G_{99} mid lambda, ldots, lambda ight)}{max _{lambda} fleft(G_{0}, G_{1}, ldots, G_{99} mid lambda, ldots, lambda ight)} ight) ) ( Lambda(X)=-2 ln left(frac{max _{lambda_{0}, ldots, lambda_{99}} fleft(G_{0}, G_{1}, ldots, G_{99} mid lambda_{0}, ldots, lambda_{99} ight)}{max _{lambda} fleft(G_{0}, G_{1}, ldots, G_{99} mid lambda, ldots, lambda ight)} ight) )

View Answer
divider
ANSWERED

Shu Naito verified

Numerade educator

Part (e) 0.0 / 2.0 points (graded) What is(are) the most plausible parameter value(s) for the alternative model given the observations? Derive the MLE(s) formula(ae). (You do not need to calculate the value(s).) Enter in terms of G_i (type G_i) and t_i (type t_i). ?_hat_i =

View Answer
divider
ANSWERED

Shu Naito verified

Numerade educator

Part (d) 0.0 / 2.0 points (graded) What is(are) the most plausible parameter value(s) for the null model given the observations? Derive the MLE(s), i.e., maximum likelihood estimators. Calculate the value of the estimator(s) from the data. (Please enter the value with a precision of three significant figures, your answer will be graded with a 2% tolerance. Hint: Please pay attention to the definition of significant figures. You can find more details from this Web link.)

View Answer
divider
ANSWERED

Ivan Kochetkov verified

Numerade educator

Part (b) More specifically, let ( G_{i} ) denote the number of gamma rays in time interval ( i, lambda_{i} ) denote the average rate of gamma rays (per second) in time interval ( i ), and ( t_{i} ) denote the length in seconds of this time interval. Fill in the blank to complete the model for data: ( G_{i} sim ) Poisson (__ (Enter lambda_i for ( lambda_{i} ) and ( t _i ) for ( t_{i} ).)

View Answer
divider
INSTANT ANSWER

4. Problem 1.2 Bookmark this page Analysis due May 29, 2024 14:59 +03 The file gamma-ray.csv contains a small quantity of data collected from the Compton Gamma Ray Observatory, a satellite launched by NASA in 1991 (http://cossc.gsfc.nasa.gov/). For each of 100 sequential time intervals of variable lengths (given in seconds), the number of gamma rays originating in a particular area of the sky was recorded. You would like to check the assumption that the emission rate is constant. Part (a) 1 point possible (graded) What is a good model for such data? Poisson Bernoulli Gaussian Binomial Submit You have used 0 of 1 attemot Save

View Answer
divider
INSTANT ANSWER

Nonlinear transformation \( 0 / 1 \) point (graded) Explore which, if any, transformations to \( X \) and \( Y \) can improve the quality of the fit and reduce the residuals. What transformations give you the best fit? None, \( X_{i}^{\prime}=X \) and \( Y_{i}^{\prime}=Y \), a linear relationship was the best we could do after all. \( X_{i}^{\prime}=X \) and \( Y_{i}^{\prime}=\ln Y_{i} \) \( X_{i}^{\prime}=\ln X_{i} \) and \( Y_{i}^{\prime}=Y \) \( X_{i}^{\prime}=\ln X_{i} \) and \( Y_{i}^{\prime}=\ln Y_{i} \) \( X_{i}^{\prime}=X \) and \( Y_{i}^{\prime}=Y^{2} \) Submit You have used 1 of 2 attempts Save

View Answer
divider