06:38
Intro Stats / AP Statistics
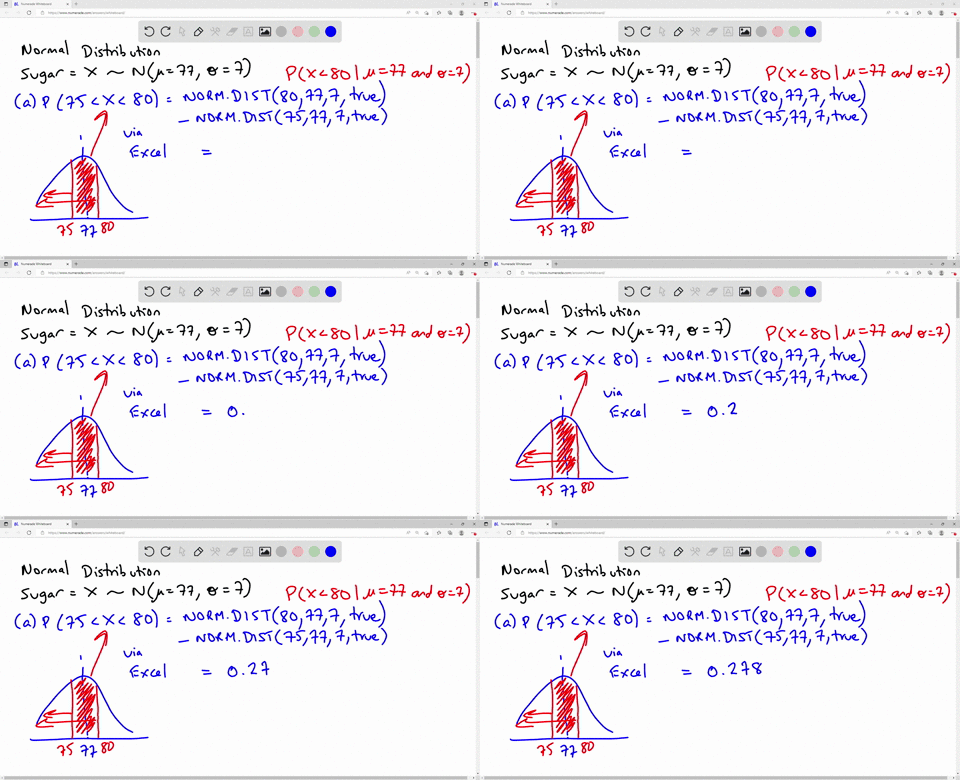
Suppose the amounts of sugar intake for adults follow a
normal distribution with an average of 77 grams per day and a
standard deviation of 7 grams per day. Draw appropriate sketches in
each case and answer the following questions:
a) [3] Find the probability that a randomly chosen adult eats
between 75 grams and 80 grams of sugar per day.
b) [3] Suppose adults whose sugar intakes are in the top 2%
among the population need more medical investigations. What is the
minimum amount of the sugar intake of the top 2%? (cut-off
point)
c) [6] A sample of 100 adult was selected at random. What is the
probability that the average sugar intake of the sampled adult is
less than 78 grams per day? (explain all the steps; the
distribution and its parameters)
d) [2] Suppose we did not know that the amounts of sugar intake
for adults follow a normal distribution, would you still be able to
find the distribution of the statistic of interest in part c?