06:35
Intro Stats / AP Statistics
11. As part of a quality control program for a catalyst
manufacturing line, the raw materials (alumina and binder) from
each shipment are tested for purity. The process requires that the
average (mean) purity of the alumina be greater than 85%. If the
mean purity of alumina is greater than 85% the shipment is
accepted. A random sample from a recent shipment of alumina yielded
the following results (in percent). Assume the normality condition
is satisfied.
93.2 87.0 92.1 90.1 87.3 93.6
Note:
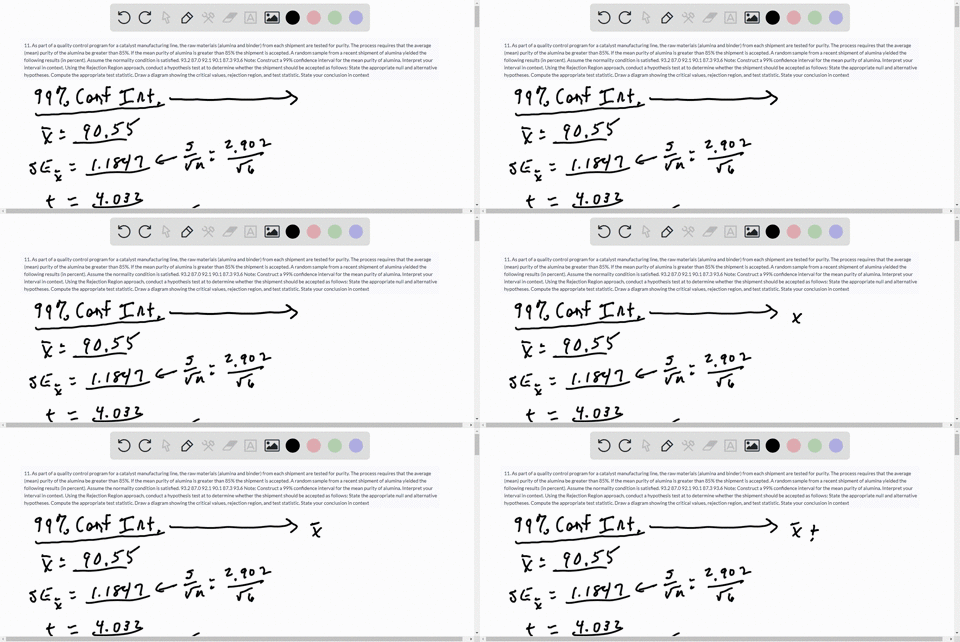
Construct a 99% confidence interval for the mean purity of
alumina.
Interpret your interval in context.
Using the Rejection Region approach, conduct a hypothesis test
at to determine whether the shipment should be accepted
as follows:
State the appropriate null and alternative hypotheses.
Compute the appropriate test statistic.
Draw a diagram showing the critical values, rejection region,
and test statistic.
State your conclusion in context