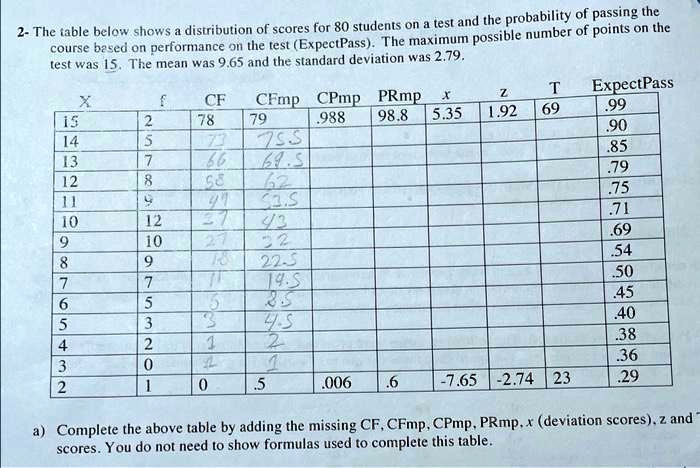
2- The table below shows a distribution of scores for 80 students on a test and the probability of passing the
course based on performance on the test (ExpectPass). The maximum possible number of points on the
test was 15. The mean was 9.65 and the standard deviation was 2.79.
X
f
CF
CFmp CPmp PRmp
x
z
T
ExpectPass
15
2
78
79
.988
98.8
5.35
1.92
69
.99
14
5
73
75.5
.90
13
7
66
69.5
.85
12
8
58
62
.79
11
9
47
53.5
.75
10
12
27
43
.71
9
10
17
32
.69
8
9
18
22.5
.54
7
7
11
14.5
.50
6
5
5
8.5
.45
5
3
3
4.5
.40
4
2
1
2
.38
3
0
1
1
.36
2
1
0
.5
.006
.6
-7.65 -2.74 23
.29
a) Complete the above table by adding the missing CF, CFmp, CPmp, PRmp, x (deviation scores), z and
scores. You do not need to show formulas used to complete this table.