Question 4 Below you will find qucstions about somc R code which analyzes the iris datasct. The dataset contains the sepal length and width as well as the petal length and width for 50 flowers from each of 3 species of iris (i.e. 150 total rows). The spccies are setosa, versicolor, and virginica
Rows:150 Columns:5 $Sepal.Length <dbl>5.1,4.9,4.7,4.6,5.0,5.4,4.6,5.0,4.4,4.9,5.4,4.- $Sepal.Width <dbl>3.5,3.0,3.2,3.1,3.6,3.9,3.4,3.4,2.9,3.1,3.7,3.- $Petal.Length <dbl>1.4,1.4,1.3,1.5,1.4,1.7,1.4,1.5,1.4,1.5,1.5,1. $Petal.Width <dbl>0.2,0.2,0.2,0.2,0.2,0.4,0.3,0.2,0.2,0.1,0.2,0.- $ Species <fct> setosa, setosa, setosa, setosa,setosa, setosa, setosa,s- tableiris$Species[iris$Sepal.Length < 5]) # Line 1 sumiris$Sepal.Length < 5 & iris$Sepal.Width > 3.1 # Line 2
(a) What does Line l produce? Briefly explain what type of output you'd expect to see.
(bWhat does Line 2 calculate? Describe in words what the code does.
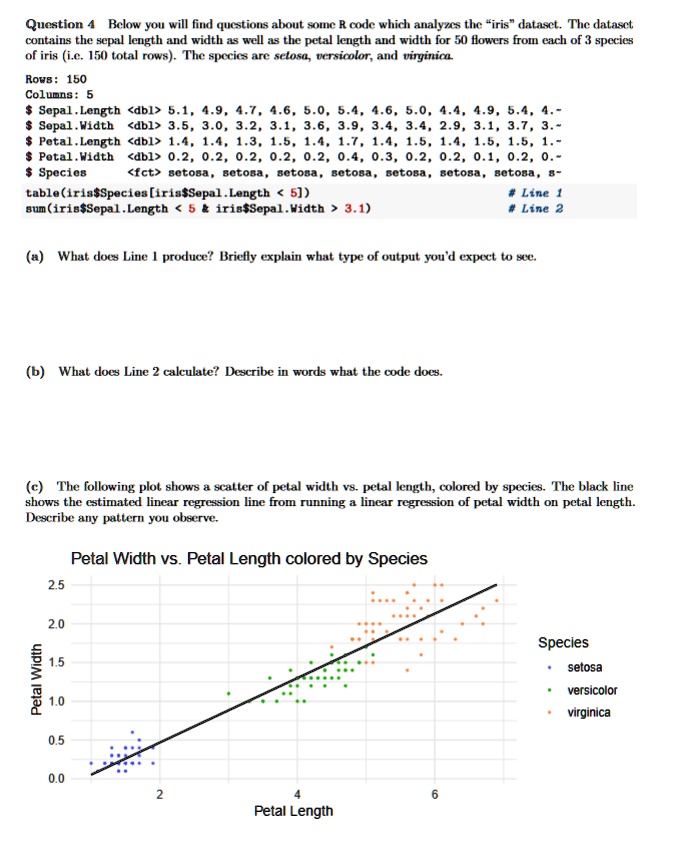
c The following plot shows a scatter of petal width vs. petal length,colored by species. The black line shows the estimated linear regression line from running a linear regression of petal width on petal length Describe any pattern you observe.
Petal Width vs.Petal Length colored by Species
2.5
2.0 1.5 Petal Width 1.0 0.5
Species
setosa
versicolor
virginica
0.0
2
4
6
Petal Length