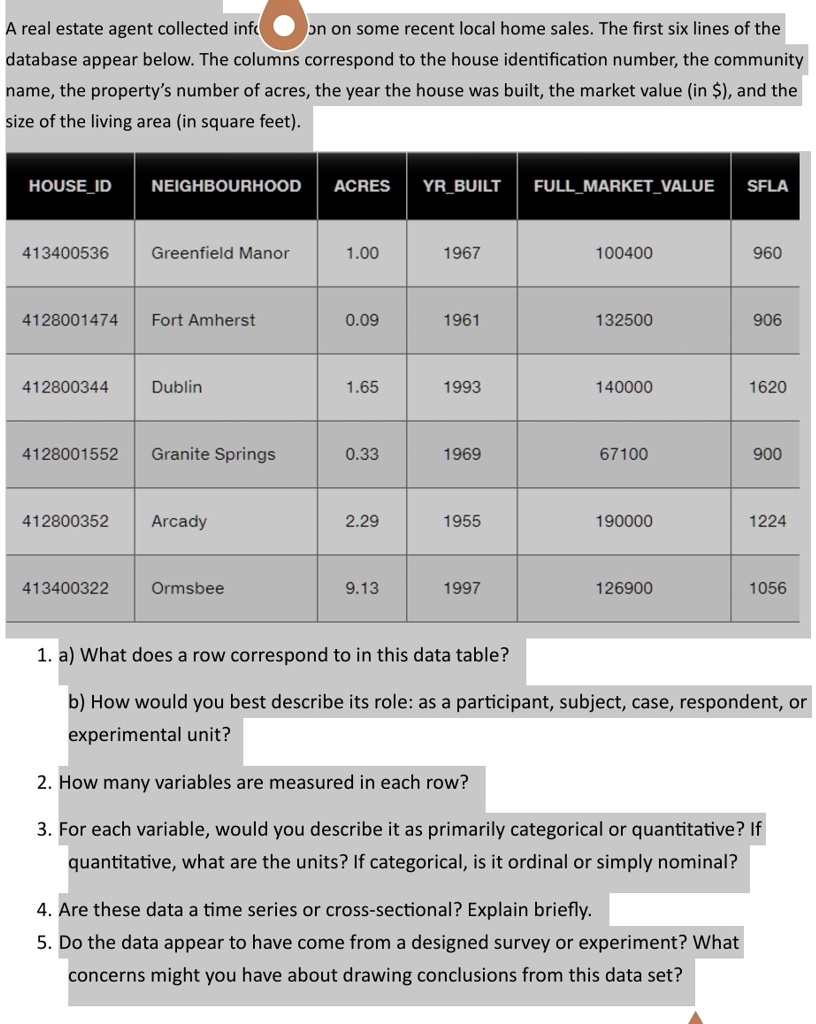
A real estate agent collected info
on on some recent local home sales. The first six lines of the
database appear below. The columns correspond to the house identification number, the community
name, the property's number of acres, the year the house was built, the market value (in $), and the
size of the living area (in square feet).
HOUSE_ID
NEIGHBOURHOOD
ACRES
YR_BUILT
FULL_MARKET_VALUE SFLA
413400536
Greenfield Manor
1.00
1967
100400
960
4128001474
Fort Amherst
0.09
1961
132500
906
412800344 Dublin
1.65
1993
140000
1620
4128001552 Granite Springs
0.33
1969
67100
900
412800352 Arcady
413400322
Ormsbee
2.29
1955
190000
1224
9.13
1997
126900
1056
1. a) What does a row correspond to in this data table?
b) How would you best describe its role: as a participant, subject, case, respondent, or
experimental unit?
2. How many variables are measured in each row?
3. For each variable, would you describe it as primarily categorical or quantitative? If
quantitative, what are the units? If categorical, is it ordinal or simply nominal?
4. Are these data a time series or cross-sectional? Explain briefly.
5. Do the data appear to have come from a designed survey or experiment? What
concerns might you have about drawing conclusions from this data set?