Two students collected data on random baseball player run-times. Players were required to run 50 yards and were timed in seconds (pitchers did not have to run). Assume that the distribution of each population (outfielders, infielders, catchers) is close enough to Normal to satisfy the Normal condition for using ANOVA. Test the hypothesis that different positions have different mean run-times, using a significance level of 0.05 . Do not do post-hoc tests.
Click the icon to view the data.
Write the null and alternative hypotheses.
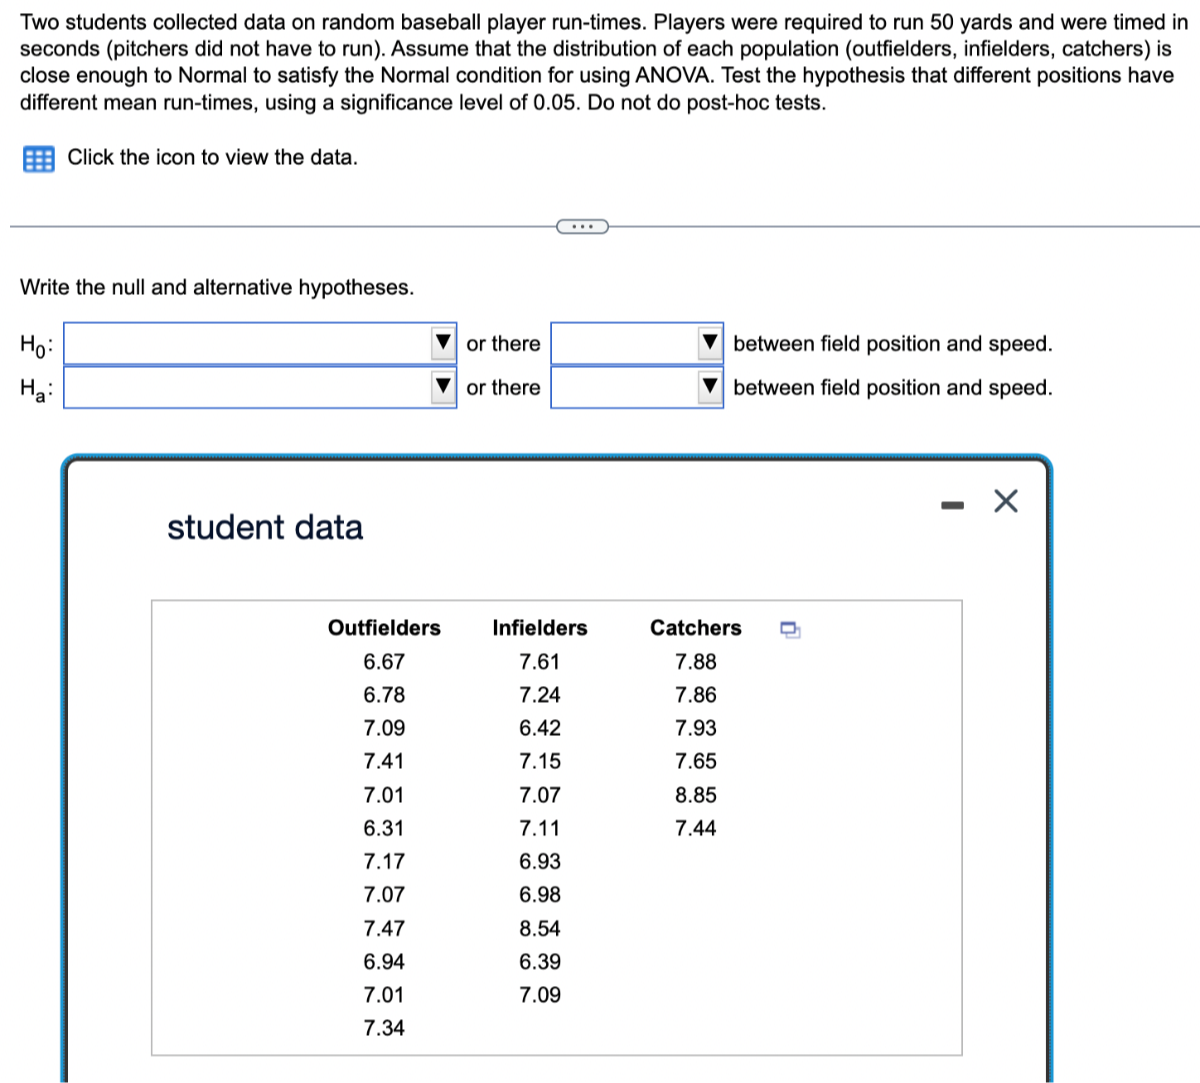
student data
\begin{tabular}{ccc}
Outfielders & Infielders & Catchers \\
6.67 & 7.61 & 7.88 \\
6.78 & 7.24 & 7.86 \\
7.09 & 6.42 & 7.93 \\
7.41 & 7.15 & 7.65 \\
7.01 & 7.07 & 8.85 \\
6.31 & 7.11 & 7.44 \\
7.17 & 6.93 & \\
7.07 & 6.98 & \\
7.47 & 8.54 & \\
6.94 & 6.39 & \\
7.01 & 7.09 & \\
7.34 & &
\end{tabular}