Section 2.5 Task 2: Scatterplots and Correlation
Car Size
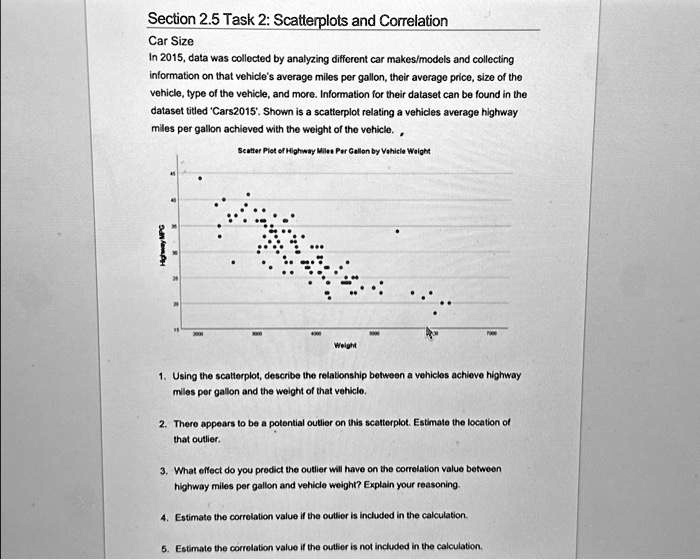
In 2015, data was collected by analyzing different car makes/models and collecting
information on that vehicle's average miles per gallon, their average price, size of the
vehicle, type of the vehicle, and more. Information for their dataset can be found in the
dataset titled 'Cars2015'. Shown is a scatterplot relating a vehicles average highway
miles per gallon achieved with the weight of the vehicle.
Scatter Plot of Highway Miles Per Gallon by Vehicle Weight
1. Using the scatterplot, describe the relationship between a vehicles achieve highway
miles per gallon and the weight of that vehicle.
2. There appears to be a potential outlier on this scatterplot. Estimate the location of
that outlier.
3. What effect do you predict the outlier will have on the correlation value between
highway miles per gallon and vehicle weight? Explain your reasoning.
4. Estimate the correlation value if the outlier is included in the calculation.
5. Estimate the correlation value if the outfier is not included in the calculation.