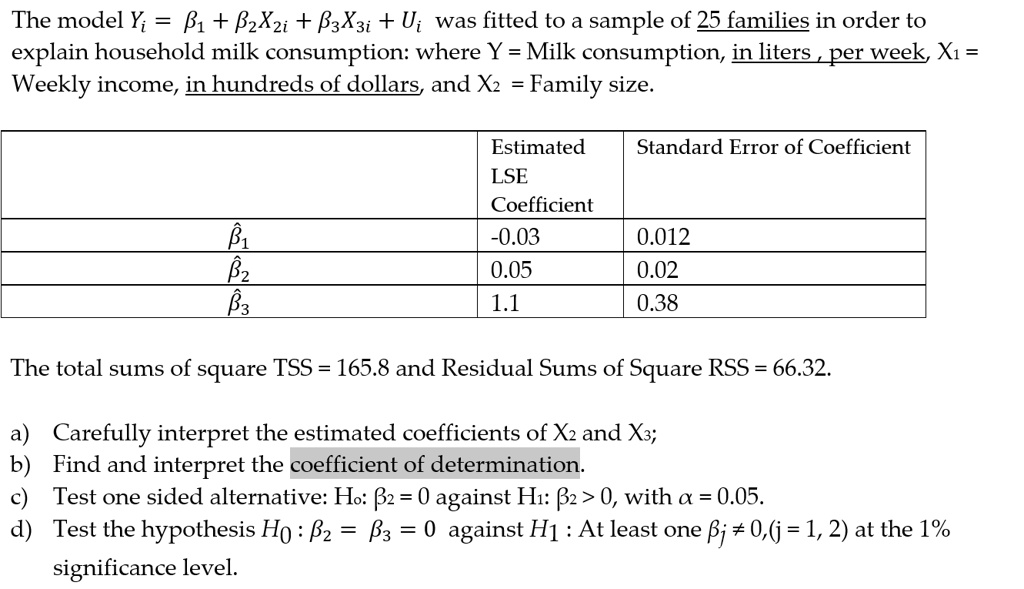
The model $Y_i = \beta_1 + \beta_2 X_{2i} + \beta_3 X_{3i} + U_i$ was fitted to a sample of 25 families in order to explain household milk consumption: where Y = Milk consumption, in liters, per week, $X_1$ = Weekly income, in hundreds of dollars, and $X_2$ = Family size.
$\hat{\beta}_1$ -0.03 0.012
$\hat{\beta}_2$ 0.05 0.02
$\hat{\beta}_3$ 1.1 0.38
The total sums of square TSS = 165.8 and Residual Sums of Square RSS = 66.32.
a) Carefully interpret the estimated coefficients of $X_2$ and $X_3$;
b) Find and interpret the coefficient of determination.
c) Test one sided alternative: $H_0: \beta_2 = 0$ against $H_1: \beta_2 > 0$, with $\alpha = 0.05$.
d) Test the hypothesis $H_0: \beta_2 = \beta_3 = 0$ against $H_1$: At least one $\beta_j \neq 0$, (j = 1, 2) at the 1% significance level.