Criteria to Implement in Your Code
The code should contain a while loop. Each pass of the while loop allows the user to create a single spectral band or other simple line shape that spans the entire x-axis range. The x-axis range should contain 1000 data points. Upon exiting the while loop, each band or line shape spectrum, each 1000 points long, should be added together (the y-values should be summed at each x-value) to result in a single complex spectrum.
Within the while loop, the user should be given line shape choices using the menu() function that can be selected at runtime. The choices should include:
1. Gaussian curve (y = A * exp(-((x - u)^2) / (2 * sigma^2)), where A is the amplitude, u is the center of the Gaussian curve or its mean position along the x-axis, and sigma serves as the width parameter for the Gaussian curve.
2. Sinusoidal curve (y = A - sin(fx)), where A is the amplitude, f is the frequency, and x is the x-axis position in radians.
3. DC offset (y = C, where C is a constant).
4. A sloped line (y = mx + b, where m is the slope and b is the intercept).
5. Noise (use the rand() function as shown in the code below).
The use of the menu() function will require you to use its return value to specify which case or lines of code within the while loop will be executed for that particular line shape.
The if, elseif, and else statements can be used to do this as demonstrated below.
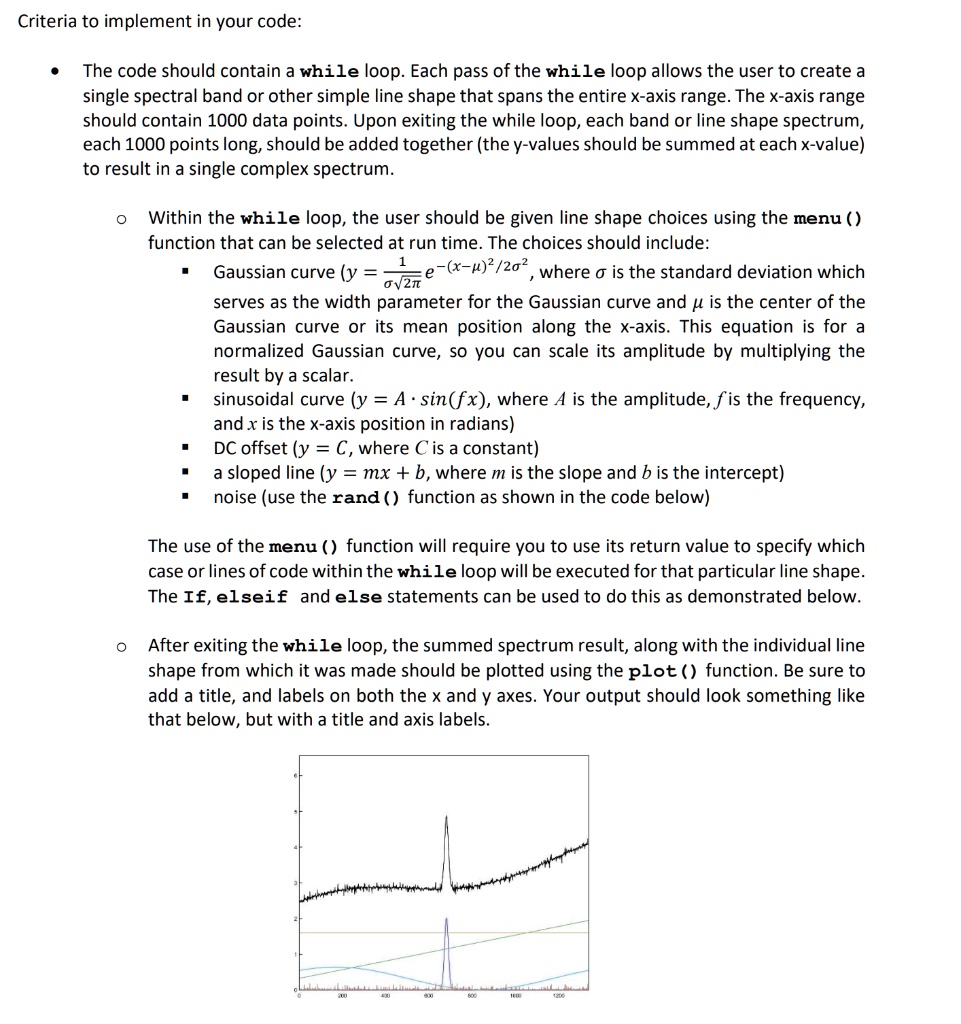
After exiting the while loop, the summed spectrum result, along with the individual line shape from which it was made, should be plotted using the plot() function. Be sure to add a title and labels on both the x and y axes. Your output should look something like that below, but with a title and axis labels.