You may need to use the appropriate technology to answer this question.
Bob Feller, an Iowa farmer, has recorded the daily high temperatures during the same five-day stretch in May over the past five
years. Bob is interested in whether this data suggests that the daily high temperature obeys a normal distribution. Use alpha =0.01
and conduct a goodness of fit test using 5 classes to see whether the following sample appears to have been selected from a
normal probability distribution. (Note: �ar{x} =71.4 and s=19.)
State the null and alternative hypotheses.
H_(0) : The population does not have a normal probability distribution.
H_(a) : The population has a normal probability distribution.
H_(0) : The population has a normal probability distribution.
H_(a) : The population does not have a normal probability distribution.
H_(0) : The population has a normal probability distribution.
H_(a) : The population has a chi ^(2) distribution.
H_(0) : The population has a normal probability distribution.
H_(a) : The population has a sampling mean distribution.
Find the value of the test statistic.
Find the p-value. (Round your answer to four decimal places.)
p-value =
State your conclusion.
Do not reject H_(0). We conclude that the population has a normal probability distribution.
Do not reject H_(0). We conclude that the population does not have a normal probability distribution.
Reject H_(0). We conclude that the population has a normal probability distribution.
Reject H_(0). We conclude that the population does not have a normal probability distribution.
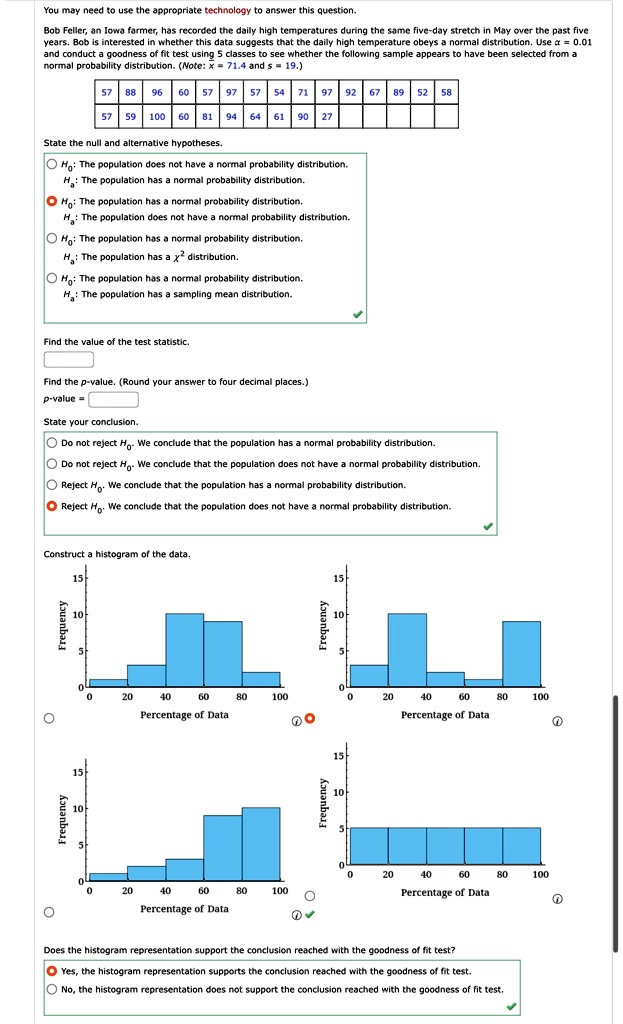
Cnnctriet a hictonram of tho Hats
Does the histogram representation support the conclusion reached with the goodness of fit test?
Yes, the histogram representation supports the conclusion reached with the goodness of fit test.
No, the histogram representation does not support the conclusion reached with the goodness of fit test.
You may need to use the appropriate technology to answer this question.
Bob Feller, an Iowa farmer, has recorded the daily high temperatures during the same five-day stretch in May over the past five
and conduct a goodness of fit test using 5 classes to see whether the following sample appears to have been selected from a normal probability distribution. (Note: x = 71.4 and s = 19.)
SS
100
State the null and alternative hypotheses.
O Ho: The population does not have a normal probability distribution. H,: The population has a normal probability distribution. O Ho: The population has a normal probability distribution. H.: The population does not have a normal probability distribution.
O H,: The population has a normal probability distribution. H. : The population has a 2 distribution.
O Ho: The population has a normal probability distribution. H.: The population has a sampling mean distribution.
Find the value of the test statistic.
Find the p-value. (Round your answer to four decimal places.)
p-value =
State your conclusion.
O Do not reject Ho- We conclude that the population has a normal probability distribution.
O Do not reject Ho- We conclude that the population does not have a normal probability distribution.
O Reject H,. We conclude that the population has a normal probability distribution.
O Reject Ho. We conclude that the population does not have a normal probability distribution.
Construct a histogram of the data.
15
Frequency 10
10
5
0
20 40 60 80 Percentage of Data
100
0
20 40 60 80 Percentage of Data
100
?
15
13
Frequency t0
Frequency 10
20
40
60
80
100
20 40 60 80 Percentage of Data
100
Percentage of Data
OV
Does the histogram representation support the conclusion reached with the goodness of fit test?
O No, the histogram representation does not support the conclusion reached with the goodness of fit test.