23 Phase diagram of ideal mixtures
Boiling Temperature of Acetone/ethanol Mixture (K)
355
350
345
340
335
330
Vapour
Dew-point
Curve
Liquid.
Bubble-point
Curve
325
0.1 0.2
03
04
0.5 0.6
0.7
0.8
Mole Fraction (x1, y1)
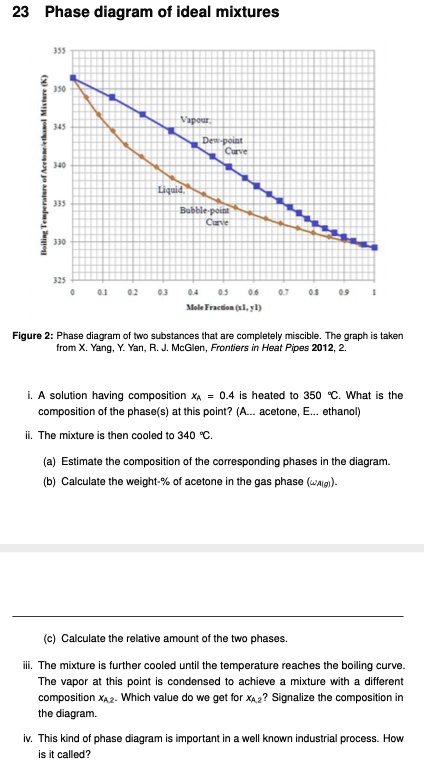
Figure 2: Phase diagram of two substances that are completely miscible. The graph is taken
from X. Yang, Y. Yan, R. J. McGlen, Frontiers in Heat Pipes 2012, 2.
i. A solution having composition $x_A$ = 0.4 is heated to 350 °C. What is the
composition of the phase(s) at this point? (A... acetone, E... ethanol)
ii. The mixture is then cooled to 340 °C.
(a) Estimate the composition of the corresponding phases in the diagram.
(b) Calculate the weight-% of acetone in the gas phase ($\omega_{A(g)}$).
(c) Calculate the relative amount of the two phases.
iii. The mixture is further cooled until the temperature reaches the boiling curve.
The vapor at this point is condensed to achieve a mixture with a different
composition $x_{A2}$. Which value do we get for $x_{A2}$? Signalize the composition in
the diagram.
iv. This kind of phase diagram is important in a well known industrial process. How
is it called?