A
B
C
D
E
F
G
H
1
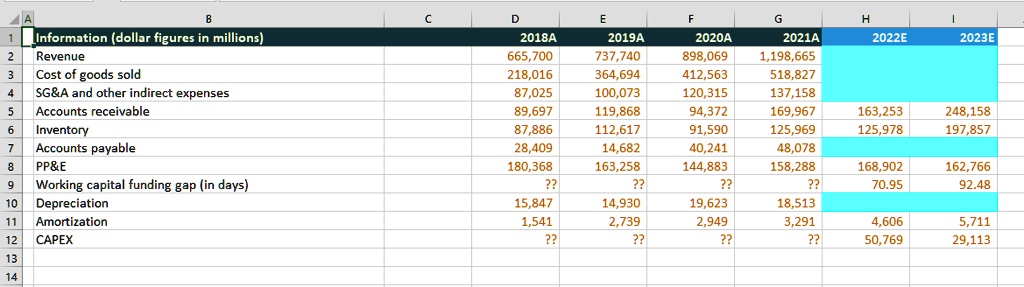
Information (dollar figures in millions)
2018A
2019A
2020A
2021A
2022E
2023E
2
Revenue
665,700
737,740
898,069
1,198,665
3
Cost of goods sold
218,016
364,694
412,563
518,827
4
SG&A and other indirect expenses
87,025
100,073
120,315
137,158
5
Accounts receivable
89,697
119.868
94,372
169,967
163.253
248,158
6
Inventory
87,886
112,617
91,590
125,969
125,978
197,857
7
Accounts payable
28,409
14,682
40,241
48,078
8
PP&E
180.368
163.258
144,883
158,288
168.902
162.766
9 Working capital funding gap (in days)
??
??
??
??
70.95
92.48
10 Depreciation
15,847
14,930
19,623
18,513
11 Amortization
1.541
2,739
2,949
3,291
4.606
5,711
12 CAPEX
??
??
??
??
50,769
29,113
13
14