Ace - AI Tutor
Ask Our Educators
Textbooks
My Library
Flashcards
Scribe - AI Notes
Notes & Exams
Download App
Hyungyu Lee

Hyungyu L.

Divider

Viewed Questions

It is a hot day, and Bert is thirsty. Here is the value he places on each bottle of water:
\begin{align*} 
\mathrm{Value \, of \, first \,bottle} \quad \$7 \\ 
\mathrm{Value \, of \, second \,bottle} \quad \$5\\
\mathrm{Value \, of \, third \,bottle} \quad \$3\\
\mathrm{Value \, of \, fourth \,bottle} \quad \$1\\
\end{align*}
a. From this information, derive Bert's demand schedule. Graph his demand curve for bottled water.
b. If the price of a bottle of water is \$4, how many bottles does Bert buy? How much consumer surplus does Bert get from his purchases? Show Bert's consumer surplus in your graph.
c. If the price falls to \$2, how does quantity demanded change? How does Bert's consumer surplus change? Show these changes in your graph.

It is a hot day, and Bert is thirsty. Here is the value he places on each bottle of water: \begin{align*} \mathrm{Value \, of \, first \,bottle} \quad \$7 \\ \mathrm{Value \, of \, second \,bottle} \quad \$5\\ \mathrm{Value \, of \, third \,bottle} \quad \$3\\ \mathrm{Value \, of \, fourth \,bottle} \quad \$1\\ \end{align*} a. From this information, derive Bert's demand schedule. Graph his demand curve for bottled water. b. If the price of a bottle of water is \$4, how many bottles does Bert buy? How much consumer surplus does Bert get from his purchases? Show Bert's consumer surplus in your graph. c. If the price falls to \$2, how does quantity demanded change? How does Bert's consumer surplus change? Show these changes in your graph.

Principles of Economics

A magnet produces a $0.30-\mathrm{T}$ field between its poles, directed to the east. A dust particle with charge $q=-8.0 \times 10^{-18} \mathrm{C}$ is moving straight down at $0.30 \mathrm{cm} / \mathrm{s}$ in this field. What is the magnitude and direction of the magnetic force on the dust particle?

A magnet produces a $0.30-\mathrm{T}$ field between its poles, directed to the east. A dust particle with charge $q=-8.0 \times 10^{-18} \mathrm{C}$ is moving straight down at $0.30 \mathrm{cm} / \mathrm{s}$ in this field. What is the magnitude and direction of the magnetic force on the dust particle?

Physics

Kyra buys an iPhone for $\$ 240$ and gets consumer surplus of $\$ 160$.
a. What is her willingness to pay?
b. If she had bought the iPhone on sale for $\$ 180$, what would her consumer surplus have been?
c. If the price of an iPhone were $\$ 500$, what would her consumer surplus have been?

Kyra buys an iPhone for $\$ 240$ and gets consumer surplus of $\$ 160$. a. What is her willingness to pay? b. If she had bought the iPhone on sale for $\$ 180$, what would her consumer surplus have been? c. If the price of an iPhone were $\$ 500$, what would her consumer surplus have been?

Principles of Economics

The primary coil of a transformer has 250 turns; the secondary coil has 1000 turns. An alternating current is sent through the primary coil. The emf in the primary is of amplitude 16 V. What is the emf amplitude in the secondary?

The primary coil of a transformer has 250 turns; the secondary coil has 1000 turns. An alternating current is sent through the primary coil. The emf in the primary is of amplitude 16 V. What is the emf amplitude in the secondary?

Physics

Questions asked

ANSWERED

Sanchit Jain verified

Numerade educator

5. Sampling distribution of proportions Ex7: We select 100 samples to investigate the obesity rate in Korea. As a result , 12 people were diagnosed with obesity. Q1. What is the sample proportion? Q2. What do you think about the population obesity rate?

View Answer
divider
ANSWERED

Sheryl Ezze verified

Numerade educator

? 'HW10_dat2.csv' is data collected to examine the effectiveness of a newly developed learning method. The learning method was applied to the students of Class A from HW10_dat1.csv. The coding book for HW10_dat2.csv is as follows. Variables | Type | Eng names | Kor names | Description ID | | Identification | ??? | Before | Numeric | Statistical scores before applying the learning method | ??? ?? ? ????? | Score After | Numeric | Statistical scores after applying the learning method | ??? ?? ? ????? | Score

View Answer
divider
ANSWERED

Sheryl Ezze verified

Numerade educator

Data Description ? 'HW10_dat1.csv' is data on the statistics scores of Class A and Class B at Y University. Class A consists of 10 students, and Class B has 8 students. The coding book for HW10_dat1.csv is as follows. Variables | Type | Eng names | Kor names | Description ID | | Identification | ??? | A | Numeric | Statistical scores of Class A students | A ? ???? ??? ?? | Score B | Numeric | Statistical scores of Class B students | B ? ???? ??? ?? | Score

View Answer
divider
ANSWERED

Breanna Ollech verified

Numerade educator

Data Description ? 'HW10_dat1.csv' is data on the statistics scores of Class A and Class B at Y University. Class A consists of 10 students, and Class B has 8 students. The coding book for HW10_dat1.csv is as follows. Variables | Type | Eng names | Kor names | Description ID | | Identification | ??? | A | Numeric | Statistical scores of Class A students | A? ???? ??? ?? | Score B | Numeric | Statistical scores of Class B students | B? ???? ??? ?? | Score ? 'HW10_dat2.csv' is data collected to examine the effectiveness of a newly developed learning method. The learning method was applied to the students of Class A from HW10_dat1.csv. The coding book for HW10_dat2.csv is as follows. Variables | Type | Eng names | Kor names | Description ID | | Identification | ??? | Before | Numeric | Statistical scores before applying the learning method | ??? ?? ? ????? | Score After | Numeric | Statistical scores after applying the learning method | ??? ?? ? ????? | Score Assume that the statistical scores follow a normal distribution. Answer the following. Q1. Using HW10_dat1.csv, test at the 10% significance level whether there is a difference in the average statistics scores between Class A and Class B. Step1) State the hypothesis Step2) State the significance level ? Step3) Calculate the test statistic Step4) Calculate the P-value and State your conclusion Q2. Using HW10_dat2.csv, test at the 1% significance level whether the learning method is effective. Step1) State the hypothesis Step2) State the significance level ? Step3) Calculate the test statistic Step4) Calculate the P-value and State your conclusion

View Answer
divider
ANSWERED

Andrew Davis verified

Numerade educator

From one year to the next, inflation falls from 5 to 4 percent, while unemployment rises from 6 to 7 percent. Which of the following events could be responsible for this change? a. The central bank increases the growth rate of the money supply. b. The government cuts spending and raises taxes to reduce the budget deficit. c. Newly discovered oil reserves cause world oil prices to plummet. d. The appointment of a new Fed chair increases expected inflation.

View Answer
divider
INSTANT ANSWER

Calculate the total refractive power of two lenses placed next to each other! Both of the lenses have a focal length of \( 18 \mathrm{~cm} \) respectively.

View Answer
divider
INSTANT ANSWER

Marked out of 1.00 We measured the longitudinal diameter of 400 red blood cells in a microscope. The mean of the diameters is \( 24.8 \mu \mathrm{m} \) and the calculated reference interval is \( 20.8-28.8 \mu \mathrm{m} \). Calculate the standard deviation of the data in units of \( \mu \mathrm{m} \) !

View Answer
divider
ANSWERED

Lucas Finney verified

Numerade educator

It is reported that students at Y University use social media for an average of 2 hours per day. To investigate this, a random sample of 10 male and 10 female students was taken from Y University, and their daily social media usage time was recorded as follows: Male 4.5 1.4 2.0 1.2 4.0 0.8 1.2 3.4 1.4 2.4 Female 2.1 1.1 1.1 2.5 4.4 3.9 2.6 2.8 3.6 4.4 Assume that the daily usage time of social media follows a normal distribution, with population variances ?_Male² = 2 and ?_Female² = 1.5 hours. Answer the following questions. Q1. It is claimed that the average daily social media usage time of male students at Y University is more than the overall student average of 2 hours. Test this claim at a 5% significance level. Step1) State the hypothesis Step2) State the significance level ? Step3) Calculate the test statistic Step4) Calculate the P-value and State your conclusion Q2. Test whether the average daily social media usage time of male and female students at Y University is the same, at a 1% significance level. Step1) State the hypothesis Step2) State the significance level ? Step3) Calculate the test statistic Step4) Calculate the P-value and State your conclusion

View Answer
divider
ANSWERED

Lucas Finney verified

Numerade educator

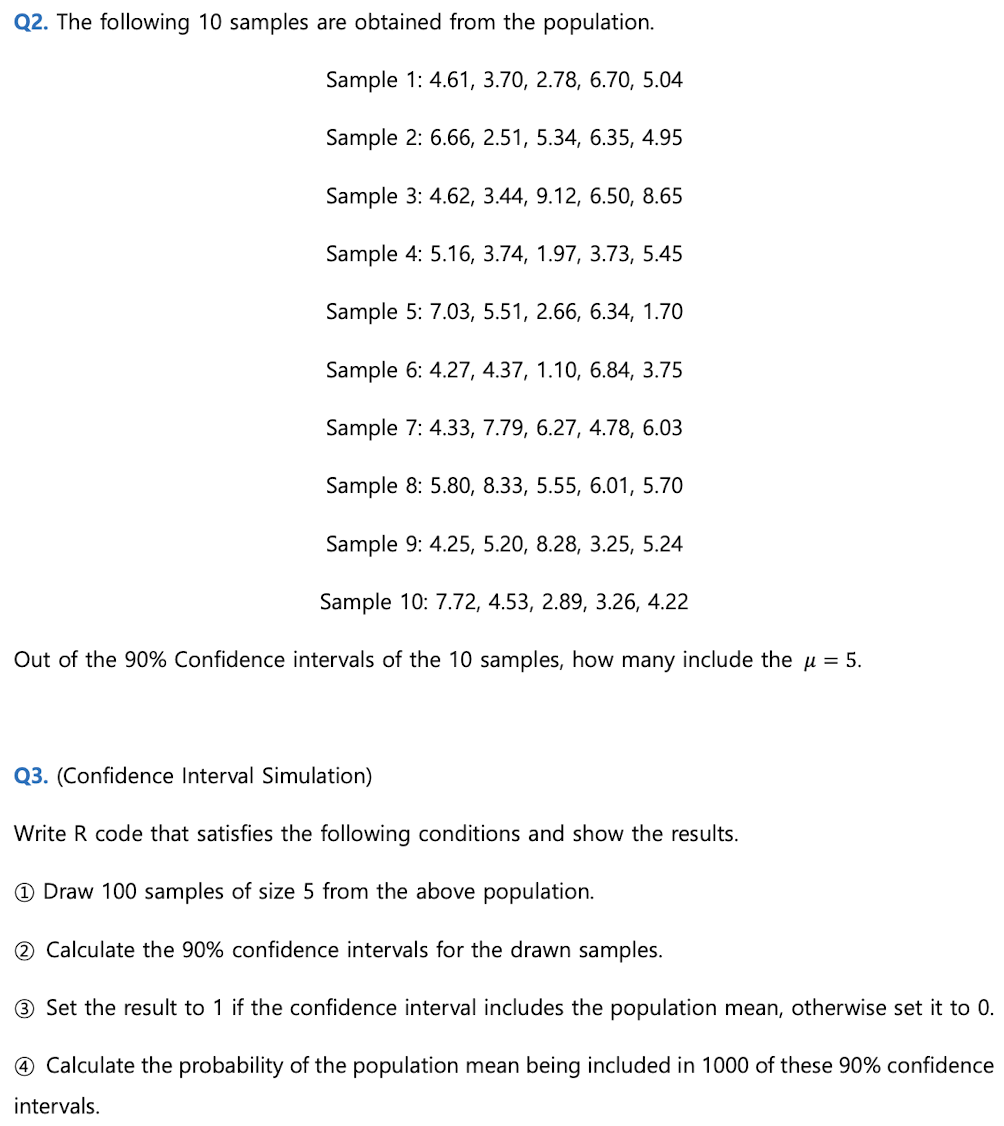
Q2. The following 10 samples are obtained from the population. Sample 1: 4.61, 3.70, 2.78, 6.70, 5.04 Sample 2: 6.66, 2.51, 5.34, 6.35, 4.95 Sample 3: 4.62, 3.44, 9.12, 6.50, 8.65 Sample 4: 5.16, 3.74, 1.97, 3.73, 5.45 Sample 5: 7.03, 5.51, 2.66, 6.34, 1.70 Sample 6: 4.27, 4.37, 1.10, 6.84, 3.75 Sample 7: 4.33, 7.79, 6.27, 4.78, 6.03 Sample 8: 5.80, 8.33, 5.55, 6.01, 5.70 Sample 9: 4.25, 5.20, 8.28, 3.25, 5.24 Sample 10: 7.72, 4.53, 2.89, 3.26, 4.22 Out of the 90% Confidence intervals of the 10 samples, how many include the ? = 5. Q3. (Confidence Interval Simulation) Write R code that satisfies the following conditions and show the results. ? Draw 100 samples of size 5 from the above population. ? Calculate the 90% confidence intervals for the drawn samples. ? Set the result to 1 if the confidence interval includes the population mean, otherwise set it to 0. ? Calculate the probability of the population mean being included in 1000 of these 90% confidence intervals.

View Answer
divider