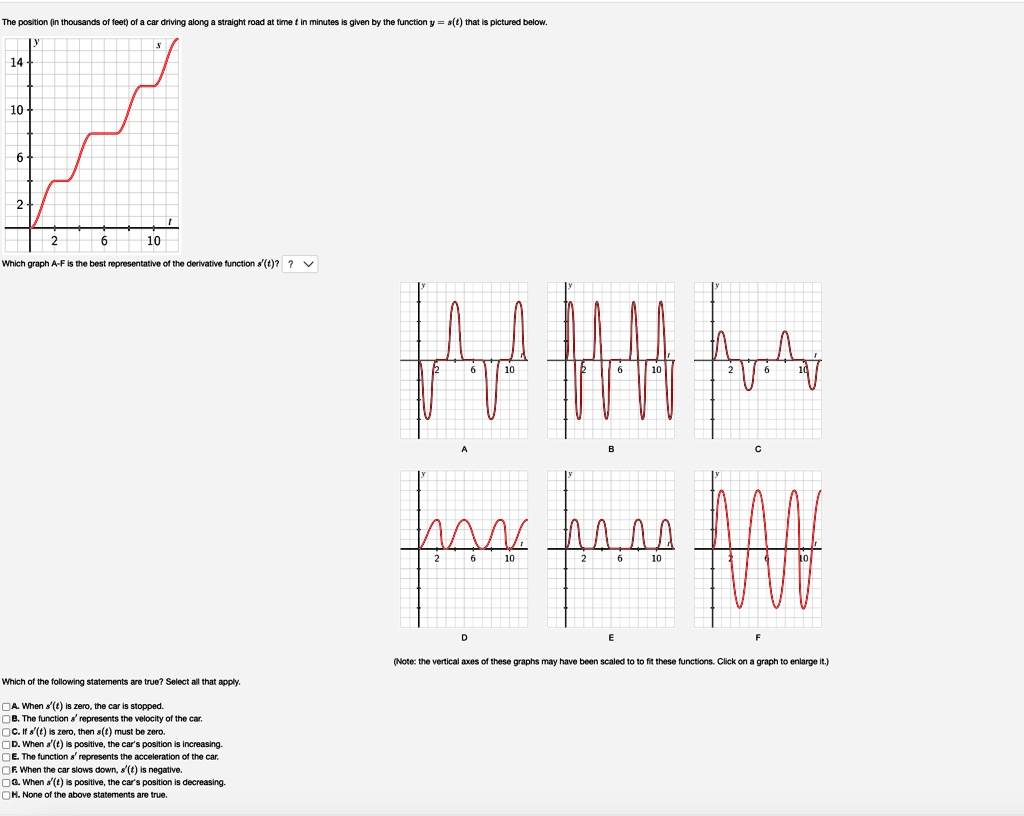
The position (in thousands of feet) of a car driving along a straight road at time $t$ in minutes is given by the function $y = s(t)$ that is pictured below.
14
10
6
2
2
6
10
Which graph A-F is the best representative of the derivative function $s'(t)$?
10
Which of the following statements are true? Select all that apply.
A. When $s'(t)$ is zero, the car is stopped.
B. The function $s'$ represents the velocity of the car.
C. If $s'(t)$ is zero, then $s(t)$ must be zero.
D. When $s'(t)$ is positive, the car's position is increasing.
E. The function $s'$ represents the acceleration of the car.
F. When the car slows down, $s'(t)$ is negative.
G. When $s'(t)$ is positive, the car's position is decreasing.
H. None of the above statements are true.
D
E
(Note: the vertical axes of these graphs may have been scaled to to fit these functions. Click on a graph to enlarge it.)