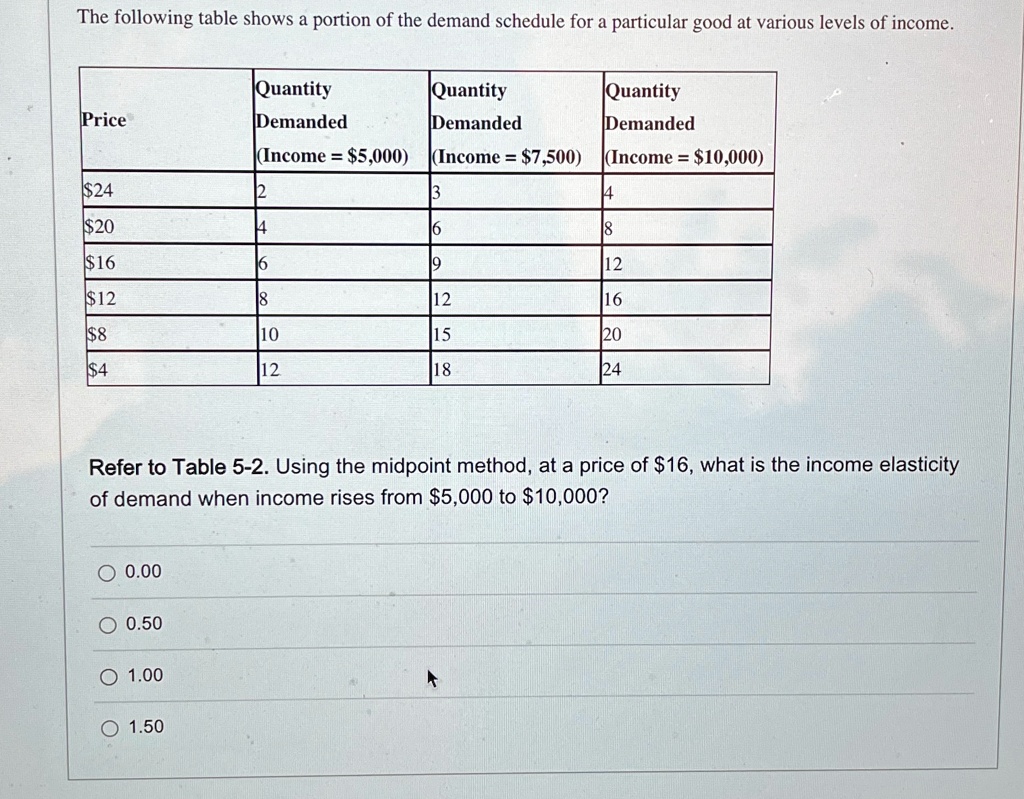
The following table shows a portion of the demand schedule for a particular good at various levels of income.
Price
Quantity
Demanded
Quantity
Demanded
Quantity
Demanded
(Income = $5,000) (Income = $7,500) (Income = $10,000)
$24
2
3
4
$20
4
6
8
$16
6
9
12
$12
8
12
16
$8
10
15
20
$4
12
18
24
Refer to Table 5-2. Using the midpoint method, at a price of $16, what is the income elasticity
of demand when income rises from $5,000 to $10,000?
? 0.00
? 0.50
? 1.00
? 1.50