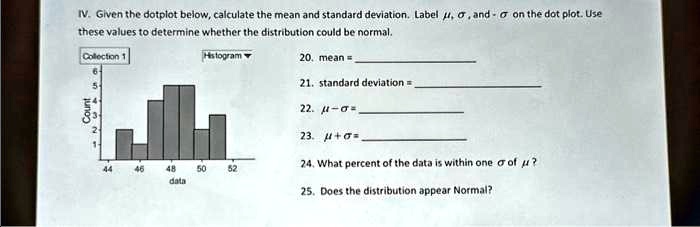
IV. Given the dotplot below, calculate the mean and standard deviation. Label ?, ?, and -? on the dot plot. Use these values to determine whether the distribution could be normal.
Collection 1 Histogram
20. mean =
21. standard deviation =
22. ? - ? =
23. ? + ? =
24. What percent of the data is within one ? of ??
25. Does the distribution appear Normal?