Texts:
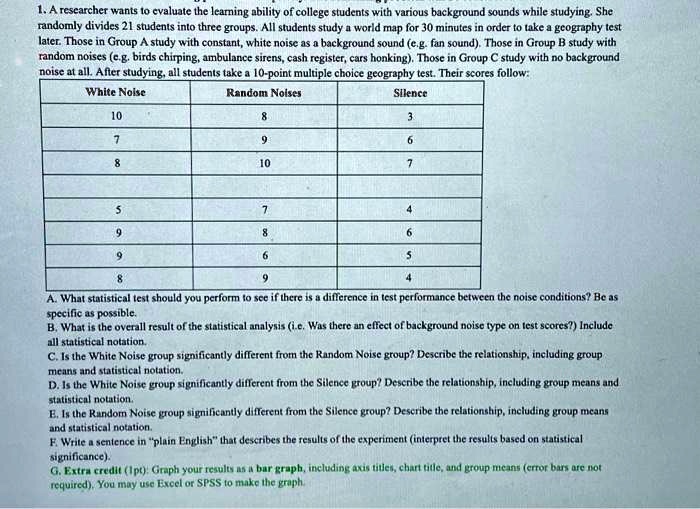
1. A researcher wants to evaluate the learning ability of college students with various background sounds while studying. She randomly divides 21 students into three groups. All students study a world map for 30 minutes in order to take a geography test later. Those in Group A study with constant, white noise as a background sound (e.g. fan sound). Those in Group B study with random noise. Those in Group C study in silence.
After studying, all students take a 10-point multiple choice geography test. Their scores follow:
Group A (White Noise): 10, 1, 8, 8, 3, 9, 6, 10, 7, 5
Group B (Random Noise): 7, 8, 6, 4, 9, 6, 9, 5, 8, 9
Group C (Silence): 4
A. What statistical test should you perform to see if there is a difference in test performance between the noise conditions? Be as specific as possible.
B. What is the overall result of the statistical analysis, i.e. was there an effect of background noise type on test scores? Include all statistical notation.
C. Is the White Noise group significantly different from the Random Noise group? Describe the relationship, including group means and statistical notation.
D. Is the White Noise group significantly different from the Silence group? Describe the relationship, including group means and statistical notation.
E. Is the Random Noise group significantly different from the Silence group? Describe the relationship, including group means and statistical notation.
F. Write a sentence in plain English that describes the results of the experiment (interpret the results based on statistical significance).
G. Extra credit: Graph your results as a bar graph, including axis titles, chart title, and group means (error bars are not required). You may use Excel or SPSS to make the graph.