PROBLEM 1 [50 pts]
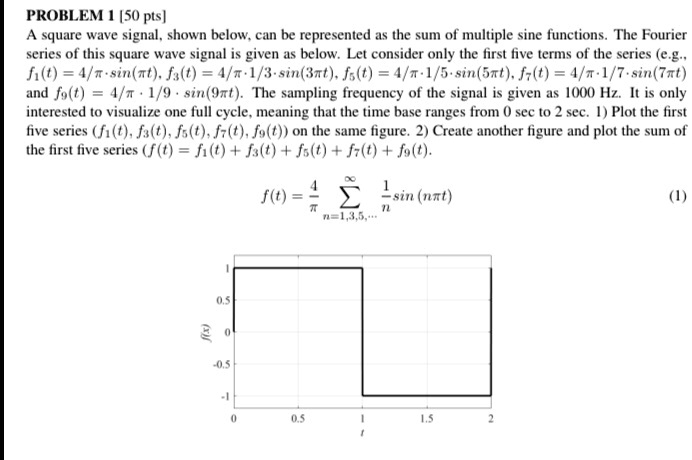
A square wave signal, shown below, can be represented as the sum of multiple sine functions. The Fourier
series of this square wave signal is given as below. Let consider only the first five terms of the series (e.g.,
f1(t) = 4/??sin(?t), f3(t) = 4/??1/3?sin(3?t), f5(t) = 4/??1/5?sin(5?t), f7(t) = 4/??1/7?sin(7?t)
and f9(t) = 4/??1/9?sin(9?t). The sampling frequency of the signal is given as 1000 Hz. It is only
interested to visualize one full cycle, meaning that the time base ranges from 0 sec to 2 sec. 1) Plot the first
five series (f1(t), f3(t), f5(t), f7(t), f9(t)) on the same figure. 2) Create another figure and plot the sum of
the first five series (f(t) = f1(t) + f3(t) + f5(t) + f7(t) + f9(t)).
$f(t) = \frac{4}{\pi} \sum_{n=1,3,5,...}^{\infty} \frac{1}{n}sin(n\pi t)$ (1)