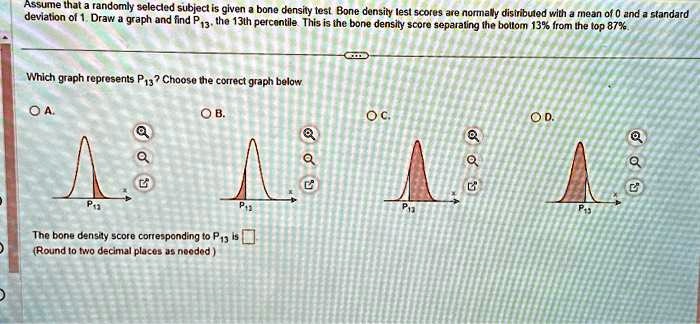
Assume that a randomly selected subject is given a bone density test. Bone density test scores are normally distributed with a mean of 0 and a standard deviation of 1. Draw a graph and find $P_{13}$, the 13th percentile. This is the bone density score separating the bottom 13% from the top 87%.
Which graph represents $P_{13}$? Choose the correct graph below
The bone density score corresponding to $P_{13}$ is
(Round to two decimal places as needed)