For this question, you are going to simulate a simple random walk.
A random walk is a stochastic process in which the position of an individual or particle
changes at random. In a simple one-dimensional random walk, the individual either takes a
step to the left with probability (1)/(2) or a step to the right with probability (1)/(2). This process is
repeated, causing the individual to gradually move away from their starting position.
We can simulate this process using a series of coin tosses. Choose a volunteer from your
table who will serve as the walker and have them choose a location where they can move 10
paces to the right and 10 paces to the left without running into an obstacle. Their starting
position will be position 0 . Now have someone at the table toss a coin. If the coin lands on
heads, the walker will move one pace to the right; otherwise, if the coin lands on tails, the
walker will move one pace the left. After they have moved, have someone record their new
position: we will use positive integers for positions to the right and negative integers for
positions to the left. Thus, if the walker has moved one step to the right, their new position
will be +1 ; if they have moved one step to the left, then their new position will be -1 . Repeat
this for a total of 20 coin tosses, recording the new position of the walker after each toss.
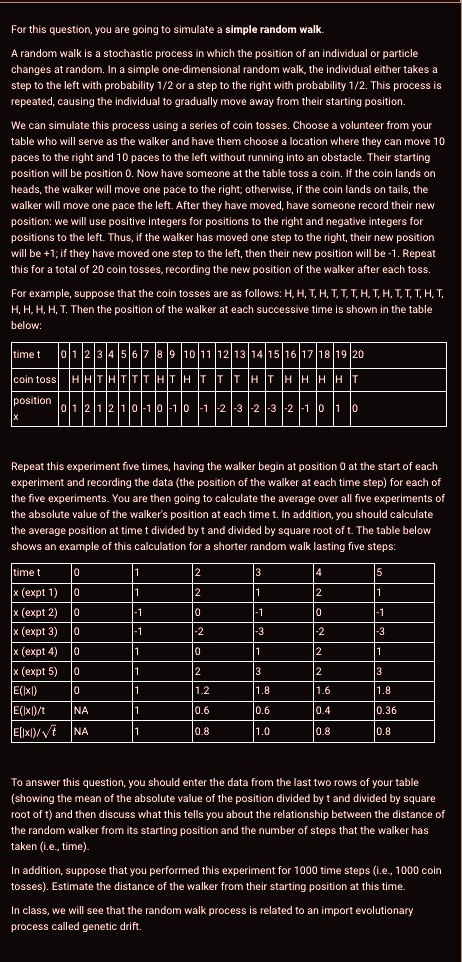
For example, suppose that the coin tosses are as follows: H,H,T,H,T,T,T,H,T,H,T,T,T,H,T,
H,H,H,H,T. Then the position of the walker at each successive time is shown in the table
below:
Repeat this experiment five times, having the walker begin at position 0 at the start of each
experiment and recording the data (the position of the walker at each time step) for each of
the five experiments. You are then going to calculate the average over all five experiments of
the absolute value of the walker's position at each time t. In addition, you should calculate
the average position at time t divided by t and divided by square root of t. The table below
shows an example of this calculation for a shorter random walk lasting five steps:
To answer this question, you should enter the data from the last two rows of your table
(showing the mean of the absolute value of the position divided by t and divided by square
root of t ) and then discuss what this tells you about the relationship between the distance of
the random walker from its starting position and the number of steps that the walker has
taken (i.e., time).
In addition, suppose that you performed this experiment for 1000 time steps (i.e., 1000 coin
tosses). Estimate the distance of the walker from their starting position at this time.
In class, we will see that the random walk process is related to an import evolutionary
process called genetic drift.
For this question, you are going to simulate a simple random walk.
A random walk is a stochastic process in which the position of an individual or particle changes at random. In a simple one-dimensional random walk, the individual either takes a step to the left with probability 1/2 or a step to the right with probability 1/2. This process is repeated, causing the individual to gradually move away from their starting position.
We can simulate this process using a series of coin tosses. Choose a volunteer from your table who will serve as the walker and have them choose a location where they can move 10 paces to the right and 10 paces to the left without running into an obstacle. Their starting position will be position 0. Now have someone at the table toss a coin. If the coin lands on heads, the walker will move one pace to the right; otherwise, if the coin lands on tails, the walker will move one pace the left. After they have moved, have someone record their new position: we will use positive integers for positions to the right and negative integers for positions to the left. Thus, if the walker has moved one step to the right, their new position will be +1; if they have moved one step to the left, then their new position will be -1. Repeat this for a total of 20 coin tosses, recording the new position of the walker after each toss.
For example, suppose that the coin tosses are as follows: H, H, T, H, T, T, T, H, T, H, T, T, T, H, T
H, H, H, H, T. Then the position of the walker at each successive time is shown in the table below:
time t
1
1819|20
coin toss
position
Repeat this experiment five times, having the walker begin at position 0 at the start of each experiment and recording the data (the position of the walker at each time step) for each of the five experiments. You are then going to calculate the average over all five experiments of the absolute value of the walker's position at each time t. In addition, you should calculate the average position at time t divided by t and divided by square root of t. The table below shows an example of this calculation for a shorter random walk lasting five steps:
time t
0
1
2
3
4
x (expt 1)
0
1
2
1
2
x (expt 2) x (expt 3) x (expt 4) x (expt 5) E(|x1) E(|x|)/t NA
0
-1
0
-1
-2
-3
-2 2 2 1.6 0.4 0.8
-3
0
3
1.2 0.6
1.8 0.6 1.0
1.8 0.36 0.8
E[|x|)//t NA
0.8
To answer this question, you should enter the data from the last two rows of your table (showing the mean of the absolute value of the position divided by t and divided by square root of t) and then discuss what this tells you about the relationship between the distance of
the random walker from its starting position and the number of steps that the walker has taken (i.e., time).
In addition, suppose that you performed this experiment for 1000 time steps (i.e., 1000 coin
tosses). Estimate the distance of the walker from their starting position at this time
In class, we will see that the random walk process is related to an import evolutionary process called genetic drift.