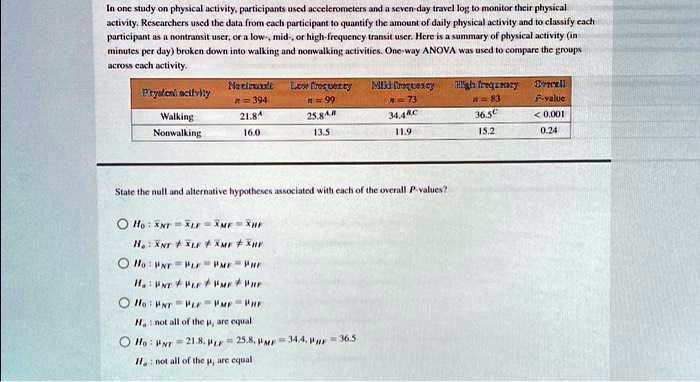
In one study on physical activity, participants used accelerometers and a seven-day travel log to monitor their physical activity. Researchers used the data from each participant to quantify the amount of daily physical activity and to classify each participant as a nontransit user, or a low, mid, or high-frequency transit user. Here is a summary of physical activity in minutes per day broken down into walking and non-walking activities. One-way ANOVA was used to compare the groups across each activity.
Activity Mean Lower Higher P-value
Walking 21.84 25.48 34.4 36.5 <0.001
Non-walking 16.0 13.5 11.9 15.2 0.24