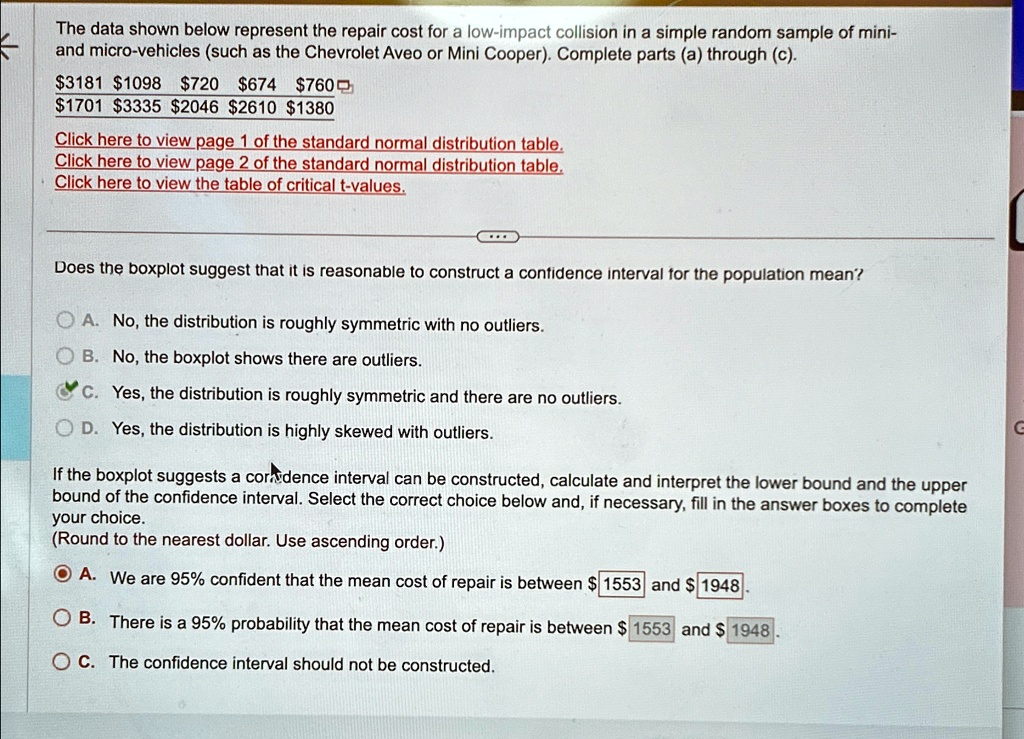
The data shown below represent the repair cost for a low-impact collision in a simple random sample of mini-
and micro-vehicles (such as the Chevrolet Aveo or Mini Cooper). Complete parts (a) through (c).
$3181 $1098 $720 $674 $760
$1701 $3335 $2046 $2610 $1380
Click here to view page 1 of the standard normal distribution table.
Click here to view page 2 of the standard normal distribution table.
Click here to view the table of critical t-values.
Does the boxplot suggest that it is reasonable to construct a confidence interval for the population mean?
A. No, the distribution is roughly symmetric with no outliers.
B. No, the boxplot shows there are outliers.
C. Yes, the distribution is roughly symmetric and there are no outliers.
D. Yes, the distribution is highly skewed with outliers.
If the boxplot suggests a confidence interval can be constructed, calculate and interpret the lower bound and the upper
bound of the confidence interval. Select the correct choice below and, if necessary, fill in the answer boxes to complete
your choice.
(Round to the nearest dollar. Use ascending order.)
A. We are 95\% confident that the mean cost of repair is between $ 1553 and $ 1948
B. There is a 95\% probability that the mean cost of repair is between $ 1553 and $ 1948
C. The confidence interval should not be constructed.