What is the shares outstanding, stock price, EPS, and Net Income Preferred Div.? Are they on this balance sheet?
PART L FISASCUL INFOEMANTON
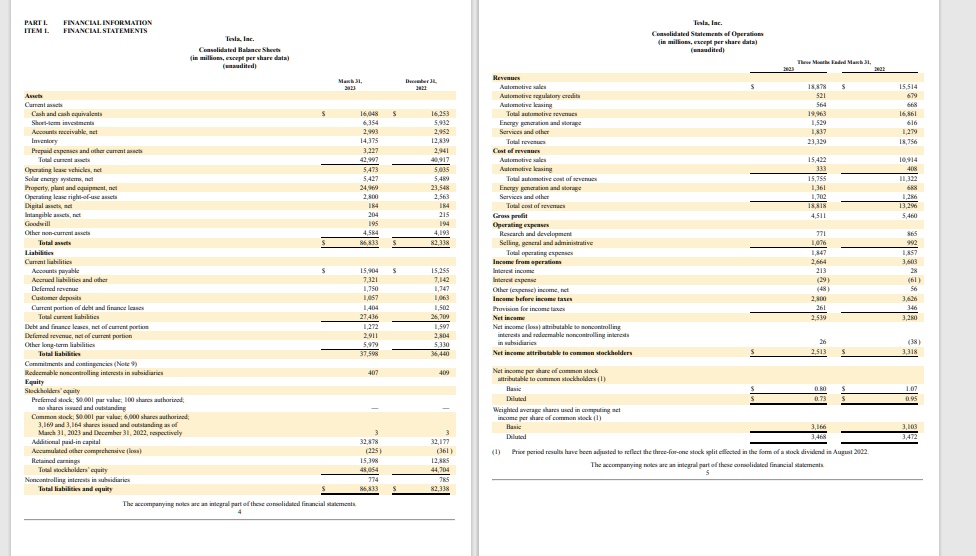
Tesla, Inc.
Consolidated Statements of Operations (in millions, except per share data) (unaudited)
(in millions, except per share data)
March 31, 2023
Tesla, Inc.
November 31, 2022
Revenues Automotive sales Automotive regulatory credits Automotive leasing Total automotive revenues Energy generation and storage Services and other
18,878
15,514 679 668 16,861 616 1,279 18,756
Assets
564 19,963 1,529 1,837 23,329
Cash and cash equivalents Short-term investments Accounts receivable, net Inventory Prepaid expenses and other current assets Total current assets Operating lease vehicles, net Solar energy systems, net Property, plant and equipment, net Operating lease right-of-use assets Digital assets, net
16,048 6,154 2,993 14,375 3,227 42,997 5,473 5,427 24,969 2,800
16,253 5,932 2,952 12,839 2,941 40,917 5,035 5,489 23,548 2,563 184 215 194 4,193 82,338
Cost of revenues Automotive sales Automotive leasing Total automotive cost of revenues Energy generation and storage Services and other Total cost of revenues (good sold) Operating expenses Research and development Selling, general and administrative Total operating expenses Income from operations Interest income Business equity Other (expense) income, net Income before income taxes Provision for income taxes Net income Net income (less) attributable to noncontrolling interests and redeemable noncontrolling interests in subsidiaries Net income attributable to common stockholders
15,422
10,914
15,755 1,361 1,702 18,818 4,511
11,322 688 1,286 13,296 5,460
195 4,584
Total assets Liabilities Current liabilities Accounts payable Income tax payable Deferred revenue
771 1,076 1,847 2,664 213 (29) (48) 2,800 261 2,539
865 912 1,857 3,603 28 (61) 56 3,626 346 3,280
15,904 7,321 1,750 1,057 1,404 27,436 1,272 2,911 5,979 37,598
15,255 7,142 1,747 1,063 1,502 26,709 1,597 2,804 5,330 36,440
Current portion of debt and finance leases Total current liabilities Debt and finance leases, net of current portion Deferred revenue, net of current portion Other long-term liabilities Total liabilities Commitments and contingencies (Note 9) Redeemable noncontrolling interests in subsidiaries Equity Stockholders' equity Preferred stock; $0.00 par value; 100 shares authorized;
26 2,513
38 3,318
407
409
Basic Diluted
0.80 0.73
1.07 0.95
Common stock; $0.001 par value; 6,000 shares authorized; 3,169 and 3,164 shares issued and outstanding as of March 31, 2023 and December 31, 2022, respectively Additional paid-in capital Accumulated other comprehensive (loss) Retained earnings
Weighted average shares used in computing net income per share of common stock (1) Basic Diluted
3,166 3,468 of a stock dividend in August 2022.
3,103 3,472
32,878 (225) 15,398 48,054 774 86,833
32,177 10 12,885 44,704 785 82,338
(1)
controlling interests in subsidiaries Total liabilities and equity