12 AA
BIU
A
Wrap Text
Merge & Center
General
Font
Alignment
Number
?
$%,00 Conditional Format as Cell
Formatting Table Styles?
Styles
? AutoSum
??
Fill-
Insert Delete Format
Cells
Clear?
Editing
Sort & Find &
Filter Select
X
?
fx
105
3
C
D
E
F
G
H
I
J
K
L
M
N
O
P
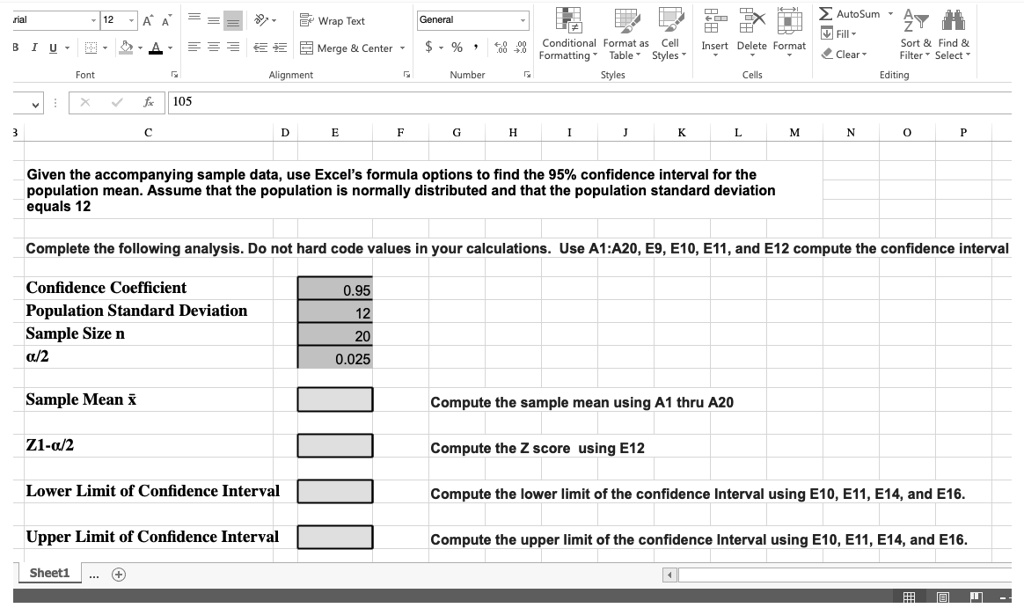
Given the accompanying sample data, use Excel's formula options to find the 95% confidence interval for the
population mean. Assume that the population is normally distributed and that the population standard deviation
equals 12
Complete the following analysis. Do not hard code values in your calculations. Use A1:A20, E9, E10, E11, and E12 compute the confidence interval
Confidence Coefficient
0.95
Population Standard Deviation
12
Sample Size n
20
?/2
0.025
Sample Mean x
Compute the sample mean using A1 thru A20
Z1-?/2
Compute the Z score using E12
Lower Limit of Confidence Interval
Compute the lower limit of the confidence Interval using E10, E11, E14, and E16.
Upper Limit of Confidence Interval
Compute the upper limit of the confidence Interval using E10, E11, E14, and E16.
Sheet1
+