4.1 Exercises
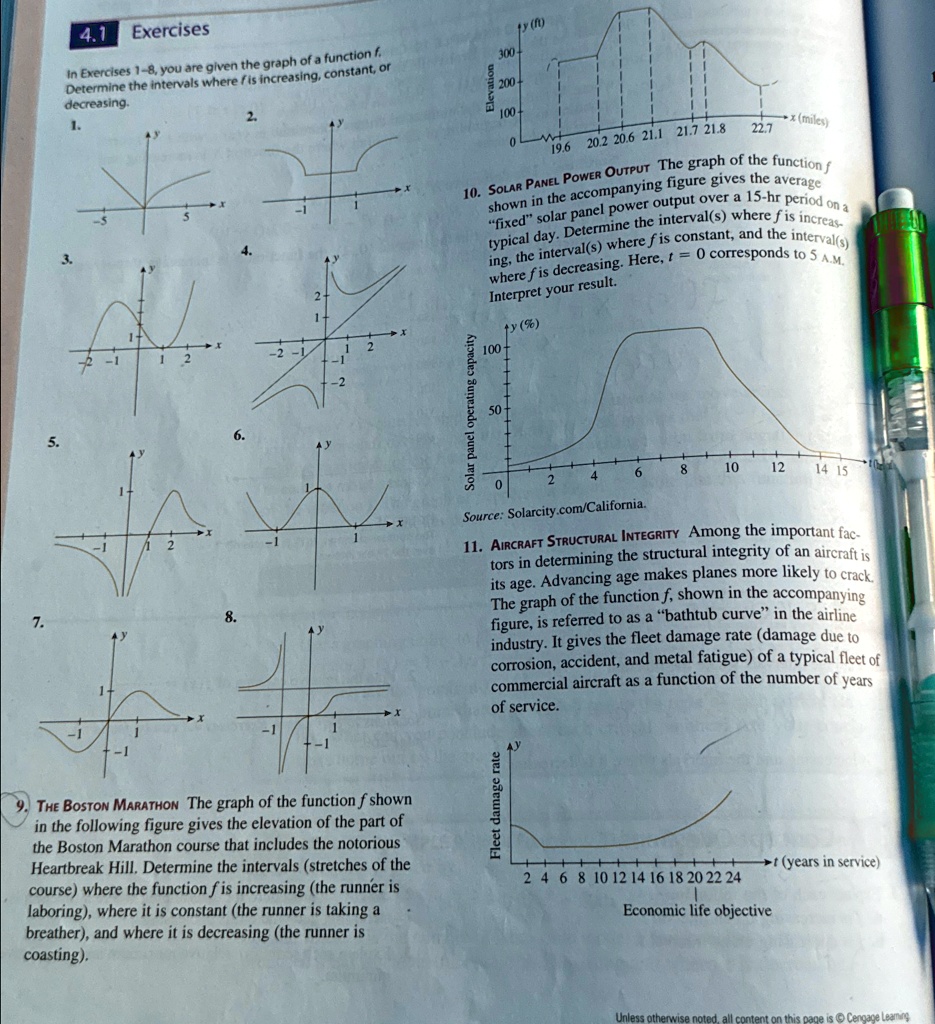
In Exercises 1-8, you are given the graph of a function f. Determine the intervals where f is increasing, constant, or decreasing.
1.
2.
3.
4.
5.
6.
7.
8.
10. SOLAR PANEL POWER OUTPUT The graph of the function f shown in the accompanying figure gives the average "fixed" solar panel power output over a 15-hr period on a typical day. Determine the interval(s) where f is increasing, the interval(s) where f is constant, and the interval(s) where f is decreasing. Here, t=0 corresponds to 5 A.M. Interpret your result.
Source: Solarcity.com/California.
11. Aircraft Structural Integrity Among the important factors in determining the structural integrity of an aircraft is its age. Advancing age makes planes more likely to crack. The graph of the function f, shown in the accompanying figure, is referred to as a "bathtub curve" in the airline industry. It gives the fleet damage rate (damage due to corrosion, accident, and metal fatigue) of a typical fleet of commercial aircraft as a function of the number of years of service.
9. The Boston Marathon The graph of the function f shown in the following figure gives the elevation of the part of the Boston Marathon course that includes the notorious Heartbreak Hill. Determine the intervals (stretches of the course) where the function f is increasing (the runner is laboring), where it is constant (the runner is taking a breather), and where it is decreasing (the runner is coasting).
10. SOLAR PANEL POWER OUTPUT The graph of the function f shown in the accompanying figure gives the average fixed solar panel power output over a 15-hr period on a typical day. Determine the interval(s) where f is increasing, the interval(s) where f is constant, and the interval(s) where f is decreasing. Here, t=0 corresponds to 5 A.M. Interpret your result.
Exercises
Source: Solarcity.com/California.