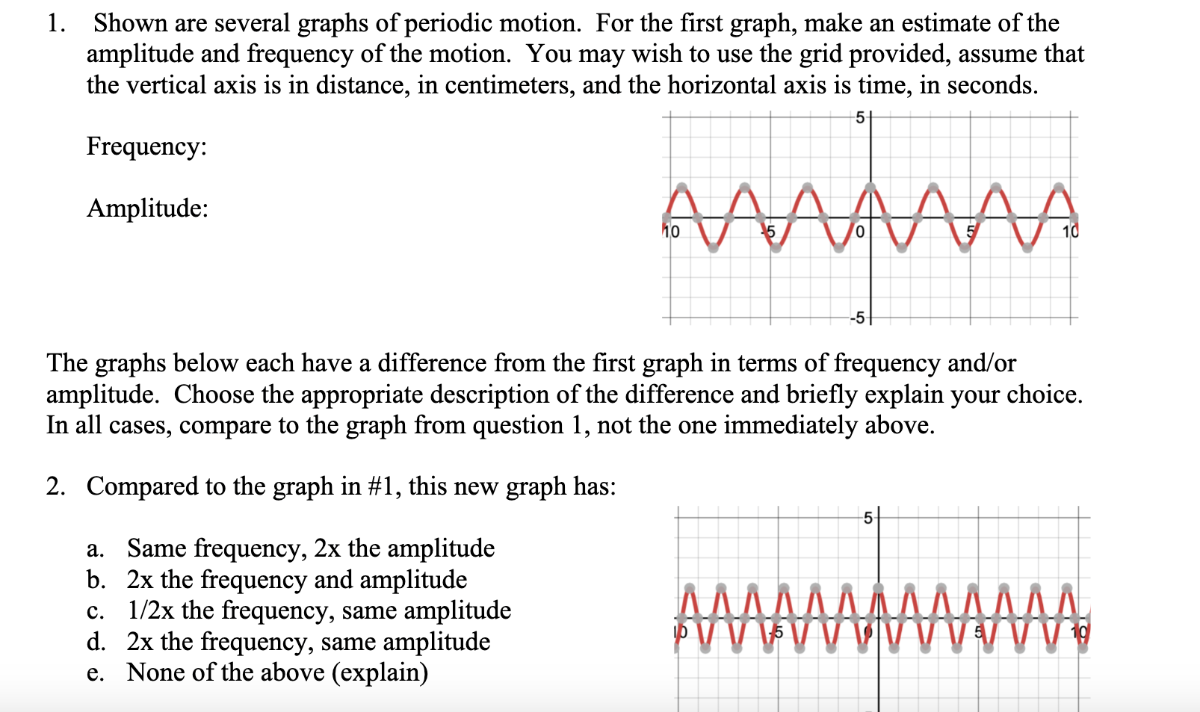
1. Shown are several graphs of periodic motion. For the first graph, make an estimate of the amplitude and frequency of the motion. You may wish to use the grid provided, assume that the vertical axis is in distance, in centimeters, and the horizontal axis is time, in seconds.
Frequency:
Amplitude:
The graphs below each have a difference from the first graph in terms of frequency and/or amplitude. Choose the appropriate description of the difference and briefly explain your choice. In all cases, compare to the graph from question 1, not the one immediately above.
2. Compared to the graph in #1, this new graph has:
a. Same frequency, ( 2 x ) the amplitude
b. ( 2 x ) the frequency and amplitude
c. ( 1 / 2 x ) the frequency, same amplitude
d. ( 2 x ) the frequency, same amplitude
e. None of the above (explain)