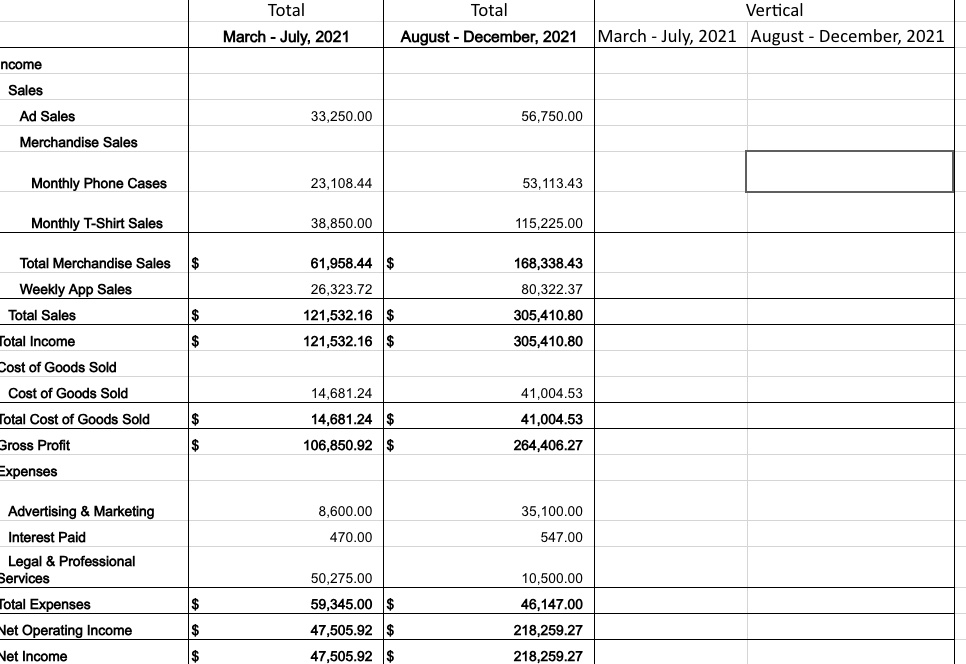
A Common-Size Vertical Analysis Report of the Income Statement. Use the Total Sales line item as the common-size. Compare 3/1 - 7/31 to 8/1 - 12/31 using the cash method of accounting. Place the data and analysis on its own sheet in your excel workbook. fill out the missing data
Total
Total
Vertical
March -July,2021
August-December,2021
March-Julv.2021August -December.2021
ncome Sales Ad Sales
33,250.00
56,750.00
Merchandise Sales
Monthly Phone Cases
23,108.44
53,113.43
Monthly T-Shirt Sales
38,850.00
115,225.00
Total Merchandise Sales
$
61,958.44
168,338.43
Weekly App Sales Total Sales Total Income
26,323.72
80.322.37
$
121,532.16 $
305.410.80
121,532.16
305,410.80
Cost of Goods Sold
Cost of Goods Sold
14,681.24
41,004.53
otal Cost of Goods Sold
$
14,681.24 $
41,004.53
Gross Profit
$
106,850.92 $
264,406.27
Expenses
Advertising & Marketing
8,600.00
35,100.00
Interest Paid
470.00
547.00
Legal&Professional Services
50,275.00
10,500.00
Total Expenses
$
59,345.00 $
46,147.00
Net Operating Income Vet Income
$
47,505.92 $
218,259.27
$
47,505.92
218,259.27