Use the table to find the percentile of the following data values. Explain the meaning of the percentile in each case.
a. A data value 2.2 standard deviations below the mean.
b. A data value 1.8 standard deviations below the mean.
c. A data value 0.6 standard deviation above the mean.
Click the icon to view the standard scores and percentiles for a normal distribution.
a. The percentile is
. Approximately
% of values in a normal distribution are
this data value.
(Type integers or decimals.)Standard Scores and Percentiles
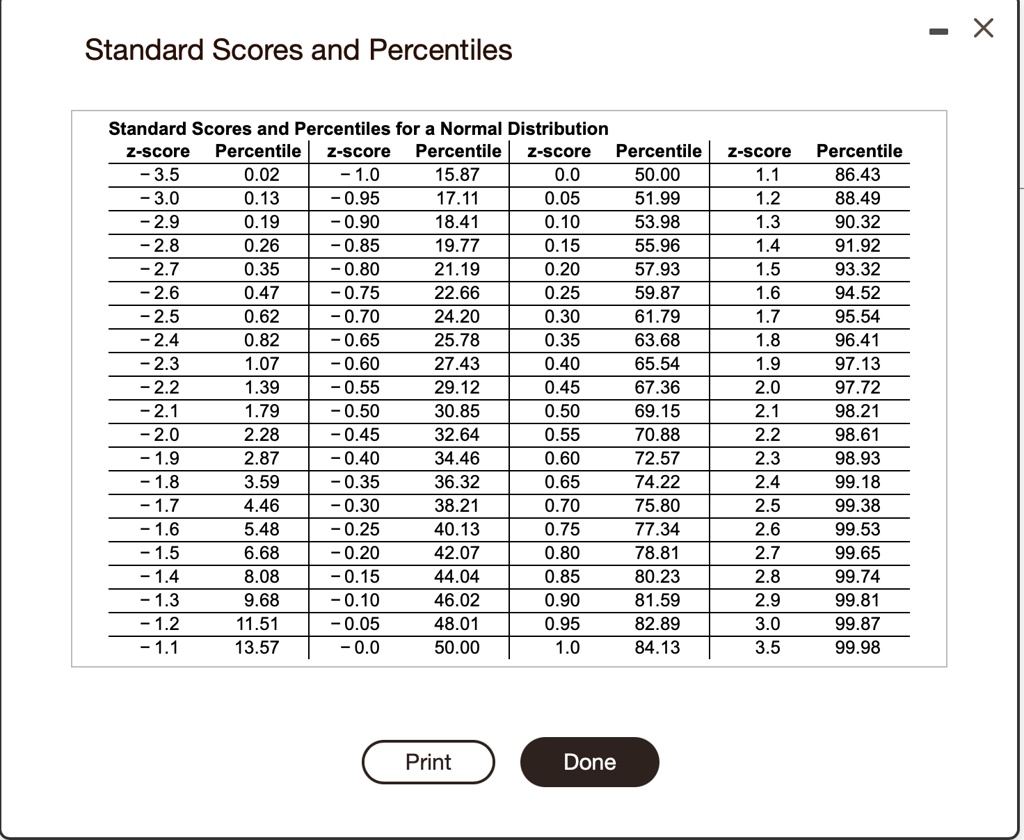
Standard Scores and Percentiles for a Normal Distribution
able[[z-score,Percentile,z-score,Percentile,z-score,Percentile,z-score,Percentile],[-3.5,0.02,-1.0,15.87,0.0,50.00,1.1,86.43],[-3.0,0.13,-0.95,17.11,0.05,51.99,1.2,88.49],[-2.9,0.19,-0.90,18.41,0.10,53.98,1.3,90.32],[-2.8,0.26,-0.85,19.77,0.15,55.96,1.4,91.92],[-2.7,0.35,-0.80,21.19,0.20,57.93,1.5,93.32],[-2.6,0.47,-0.75,22.66,0.25,59.87,1.6,94.52],[-2.5,0.62,-0.70,24.20,0.30,61.79,1.7,95.54],[-2.4,0.82,-0.65,25.78,0.35,63.68,1.8,96.41],[-2.3,1.07,-0.60,27.43,0.40,65.54,1.9,97.13],[-2.2,1.39,-0.55,29.12,0.45,67.36,2.0,97.72],[-2.1,1.79,-0.50,30.85,0.50,69.15,2.1,98.21],[-2.0,2.28,-0.45,32.64,0.55,70.88,2.2,98.61],[-1.9,2.87,-0.40,34.46,0.60,72.57,2.3,98.93],[-1.8,3.59,-0.35,36.32,0.65,74.22,2.4,99.18],[-1.7,4.46,-0.30,38.21,0.70,75.80,2.5,99.38],[-1.6,5.48,-0.25,40.13,0.75,77.34,2.6,99.53],[-1.5,6.68,-0.20,42.07,0.80,78.81,2.7,99.65],[-1.4,8.08,-0.15,44.04,0.85,80.23,2.8,99.74],[-1.3,9.68,-0.10,46.02,0.90,81.59,2.9,99.81],[-1.2,11.51,-0.05,48.01,0.95,82.89,3.0,99.87],[-1.1,13.57,-0.0,50.00,1.0,84.13,3.5,99.98]]
X
Standard Scores and Percentiles
Standard Scores and Percentiles for a Normal Distribution z-score Percentile z-score Percentile z-score Percentile 3.5 0.02 1.0 15.87 0.0 50.00 3.0 0.13 -0.95 17.11 0.05 51.99 2.9 0.19 -0.90 18.41 0.10 53.98 2.8 0.26 0.85 19.77 0.15 55.96 2.7 0.35 0.80 21.19 0.20 57.93 2.6 0.47 0.75 22.66 0.25 59.87 2.5 0.62 0.70 24.20 0.30 61.79 2.4 0.82 0.65 25.78 0.35 63.68 2.3 1.07 0.60 27.43 0.40 65.54 2.2 1.39 -0.55 29.12 0.45 67.36 2.1 1.79 -0.50 30.85 0.50 69.15 2.0 2.28 0.45 32.64 0.55 70.88 1.9 2.87 -0.40 34.46 0.60 72.57 1.8 3.59 0.35 36.32 0.65 74.22 1.7 4.46 -0.30 38.21 0.70 75.80 - 1.6 5.48 0.25 40.13 0.75 77.34 1.5 6.68 0.20 42.07 0.80 78.81 1.4 8.08 -0.15 44.04 0.85 80.23 1.3 9.68 -0.10 46.02 0.90 81.59 1.2 11.51 0.05 48.01 0.95 82.89 - 1.1 13.57 0.0 50.00 1.0 84.13
z-score 1.1 1.2 1.3 1.4 1.5 1.6 1.7 1.8 1.9 2.0 2.1 2.2 2.3 2.4 2.5 2.6 2.7 2.8 2.9 3.0 3.5
Percentile 86.43 88.49 90.32 91.92 93.32 94.52 95.54 96.41 97.13 97.72 98.21 98.61 98.93 99.18 99.38 99.53 99.65 99.74 99.81 99.87 99.98
Print
Done