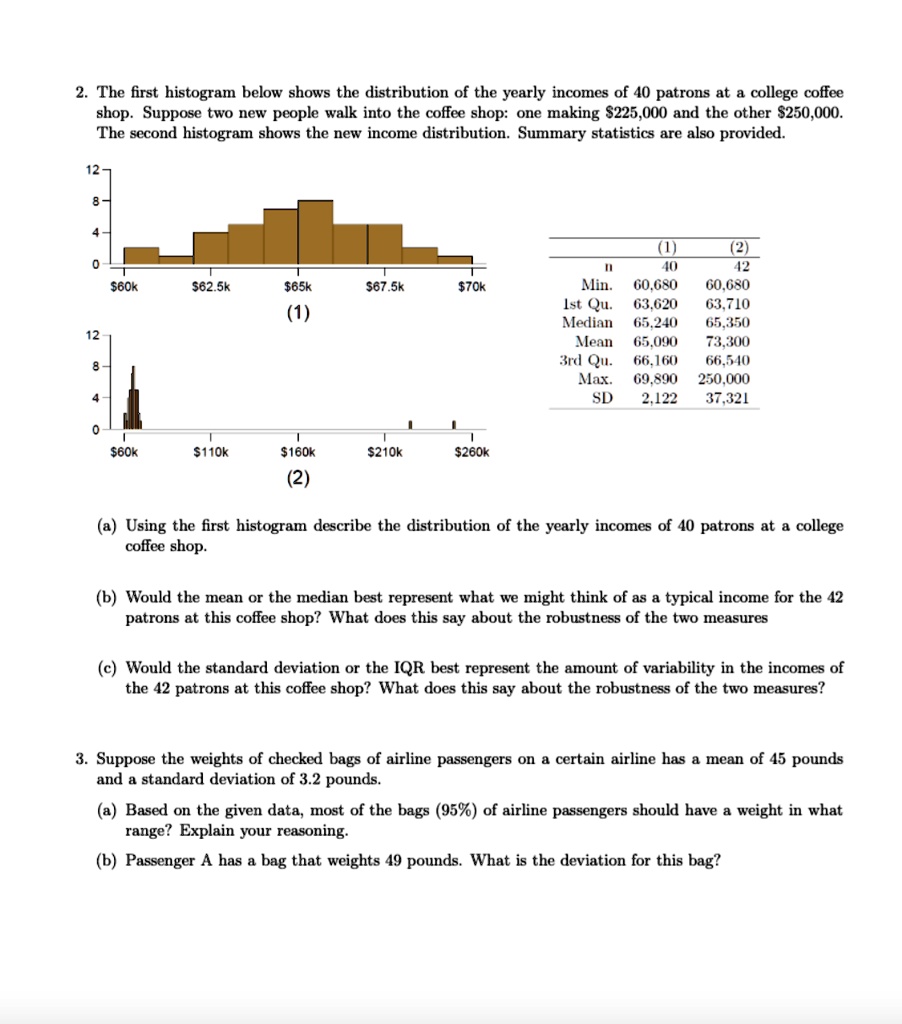
2. The first histogram below shows the distribution of the yearly incomes of 40 patrons at a college coffee
shop. Suppose two new people walk into the coffee shop: one making $225,000 and the other $250,000.
The second histogram shows the new income distribution. Summary statistics are also provided.
12-
8-
4-
0
(1)
(2)
n 40 42
Min. 60,680 60,680
1st Qu. 63,620 63,710
Median 65,240 65,350
Mean 65,090 73,300
3rd Qu. 66,160 66,540
Max. 69,890 250,000
SD 2,122 37,321
12-
8-
4-
0
$60k $62.5k $65k $67.5k $70k
(1)
$60k $110k $160k $210k $260k
(2)
(a) Using the first histogram describe the distribution of the yearly incomes of 40 patrons at a college
coffee shop.
(b) Would the mean or the median best represent what we might think of as a typical income for the 42
patrons at this coffee shop? What does this say about the robustness of the two measures
(c) Would the standard deviation or the IQR best represent the amount of variability in the incomes of
the 42 patrons at this coffee shop? What does this say about the robustness of the two measures?
3. Suppose the weights of checked bags of airline passengers on a certain airline has a mean of 45 pounds
and a standard deviation of 3.2 pounds.
(a) Based on the given data, most of the bags (95%) of airline passengers should have a weight in what
range? Explain your reasoning.
(b) Passenger A has a bag that weights 49 pounds. What is the deviation for this bag?