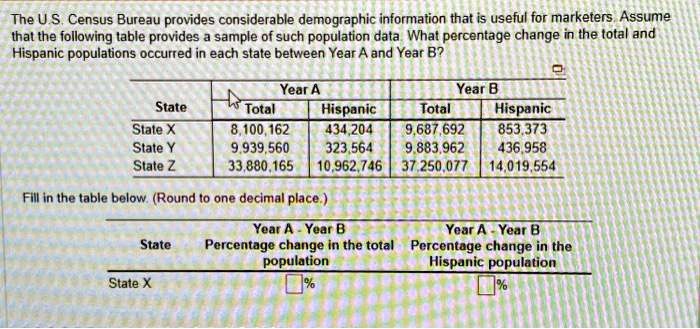
The U.S. Census Bureau provides considerable demographic information that is useful for marketers. Assume
that the following table provides a sample of such population data. What percentage change in the total and
Hispanic populations occurred in each state between Year A and Year B?
Year B
Hispanic Total Hispanic
853,373
Year A
State
Total
State X
8,100,162
State Y
State Z
9,939,560 323,564
9,883,962 436,958
434,204 9,687,692
?
33,880,165 10,962,746 37.250,077 14,019,554
Fill in the table below. (Round to one decimal place.)
State
Year A - Year B
Year A - Year B
Percentage change in the total Percentage change in the
State X
population
%
Hispanic population
%