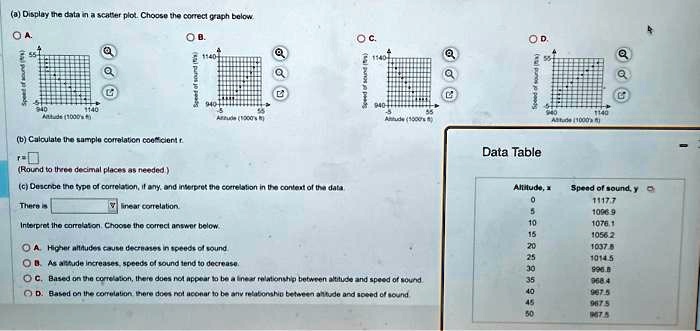
(a) Display the data in a scatter plot. Choose the correct graph below.
(b) Calculate the sample correlation coefficient $r$.
$r = ?$
(Round to three decimal places as needed.)
(c) Describe the type of correlation, if any, and interpret the correlation in the context of the data.
There is ? linear correlation.
Interpret the correlation. Choose the correct answer below.
A. Higher altitudes cause decreases in speeds of sound.
B. As altitude increases, speeds of sound tend to decrease.
C. Based on the correlation, there does not appear to be a linear relationship between altitude and speed of sound.
D. Based on the correlation, there does not appear to be any relationship between altitude and speed of sound.
Data Table
Altitude, $x$ Speed of sound, $y$
0 1117.7
5 1096.9
10 1076.1
15 1056.2
20 1037.8
25 1014.5
30 996.8
35 968.4
40 967.5
45 967.5
50 967.5