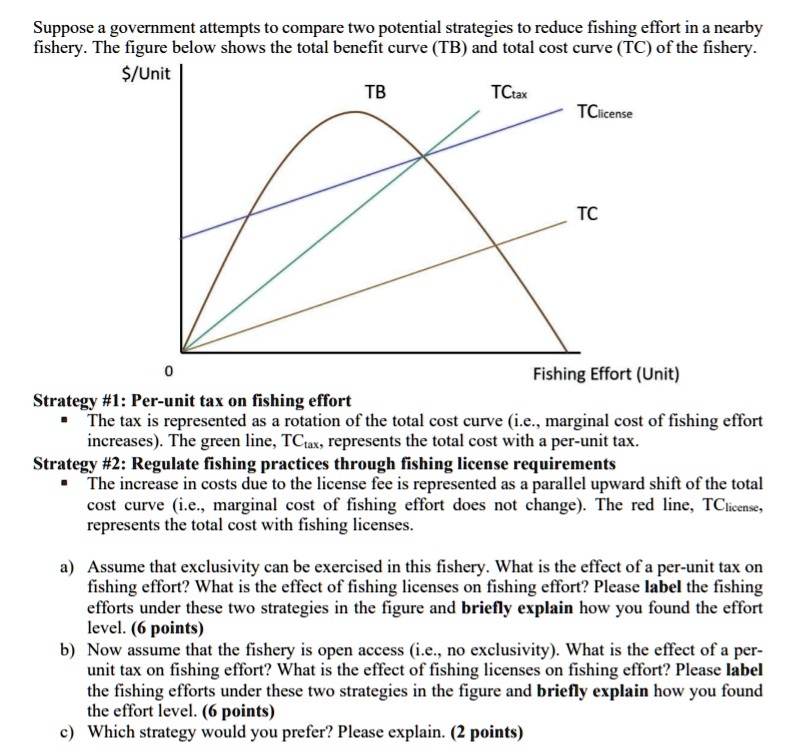
Suppose a government attempts to compare two potential strategies to reduce fishing effort in a nearby
fishery. The figure below shows the total benefit curve (TB) and total cost curve (TC) of the fishery.
$/Unit
TB
TCtax
TClicense
TC
0
Fishing Effort (Unit)
Strategy #1: Per-unit tax on fishing effort
. The tax is represented as a rotation of the total cost curve (i.e., marginal cost of fishing effort
increases). The green line, $TC_{tax}$, represents the total cost with a per-unit tax.
Strategy #2: Regulate fishing practices through fishing license requirements
. The increase in costs due to the license fee is represented as a parallel upward shift of the total
cost curve (i.e., marginal cost of fishing effort does not change). The red line, $TC_{license}$,
represents the total cost with fishing licenses.
a) Assume that exclusivity can be exercised in this fishery. What is the effect of a per-unit tax on
fishing effort? What is the effect of fishing licenses on fishing effort? Please label the fishing
efforts under these two strategies in the figure and briefly explain how you found the effort
level. (6 points)
b) Now assume that the fishery is open access (i.e., no exclusivity). What is the effect of a per-
unit tax on fishing effort? What is the effect of fishing licenses on fishing effort? Please label
the fishing efforts under these two strategies in the figure and briefly explain how you found
the effort level. (6 points)
c) Which strategy would you prefer? Please explain. (2 points)