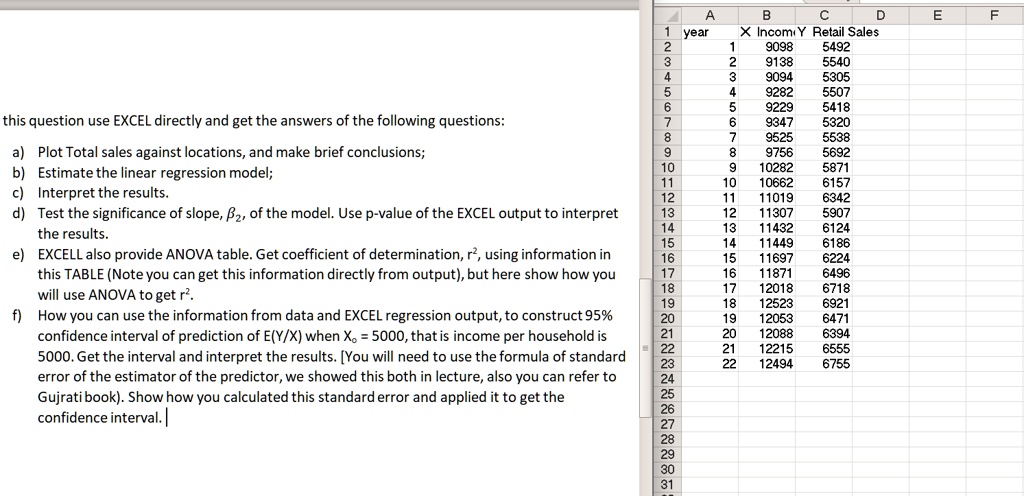
A B C D 1 year X Income Retail Sales 2 1 9098 5492 3 2 9138 5540 4 3 9094 5305 5 4 9282 5507 6 5 9229 5418 7 6 9347 5320 8 7 9525 5538 9 8 9756 5692 10 9 10282 5871 11 10 10662 6157 12 11 11019 6342 13 12 11307 5907 14 13 11432 6124 15 14 11449 6186 16 15 11697 6224 17 16 11871 6496 18 17 12018 6718 19 18 12523 6921 20 19 12053 6471 21 20 12088 6394 22 21 12215 6555 23 22 12494 6755 24 25
E
F
This question uses Excel directly and get the answers to the following questions:
a) Plot Total sales against locations, and make brief conclusions;
b) Estimate the linear regression model Interpret the results
c) Test the significance of slope, 2, of the model. Use p-value of the Excel output to interpret the results
d) Excel also provides ANOVA table. Get coefficient of determination, r, using information in this table (Note you can get this information directly from output), but here show how you will use ANOVA to get r2
e) How you can use the information from data and Excel regression output, to construct 95% confidence interval of prediction of E(Y/X when X = 5000, that is income per household is 5000. Get the interval and interpret the results. [You will need to use the formula of standard error of the estimator of the predictor, we showed this both in lecture, also you can refer to Gujrati book. Show how you calculated this standard error and applied it to get the confidence interval.