A chain of restaurants has historically had a mean wait time of 9 minutes for its customers. Recently, the restaurant added several very popular dishes back to their menu. Due to this, the manager suspects the wait time, \(\mu\), has increased. He takes a random sample of 44 customers. The mean wait time for the sample is 10.4 minutes. Assume, the population standard deviation for the wait times is known to be 4.1 minutes.
Can the manager conclude that the mean wait time is now greater than 9 minutes? Perform a hypothesis test, using the 0.01 level of significance.
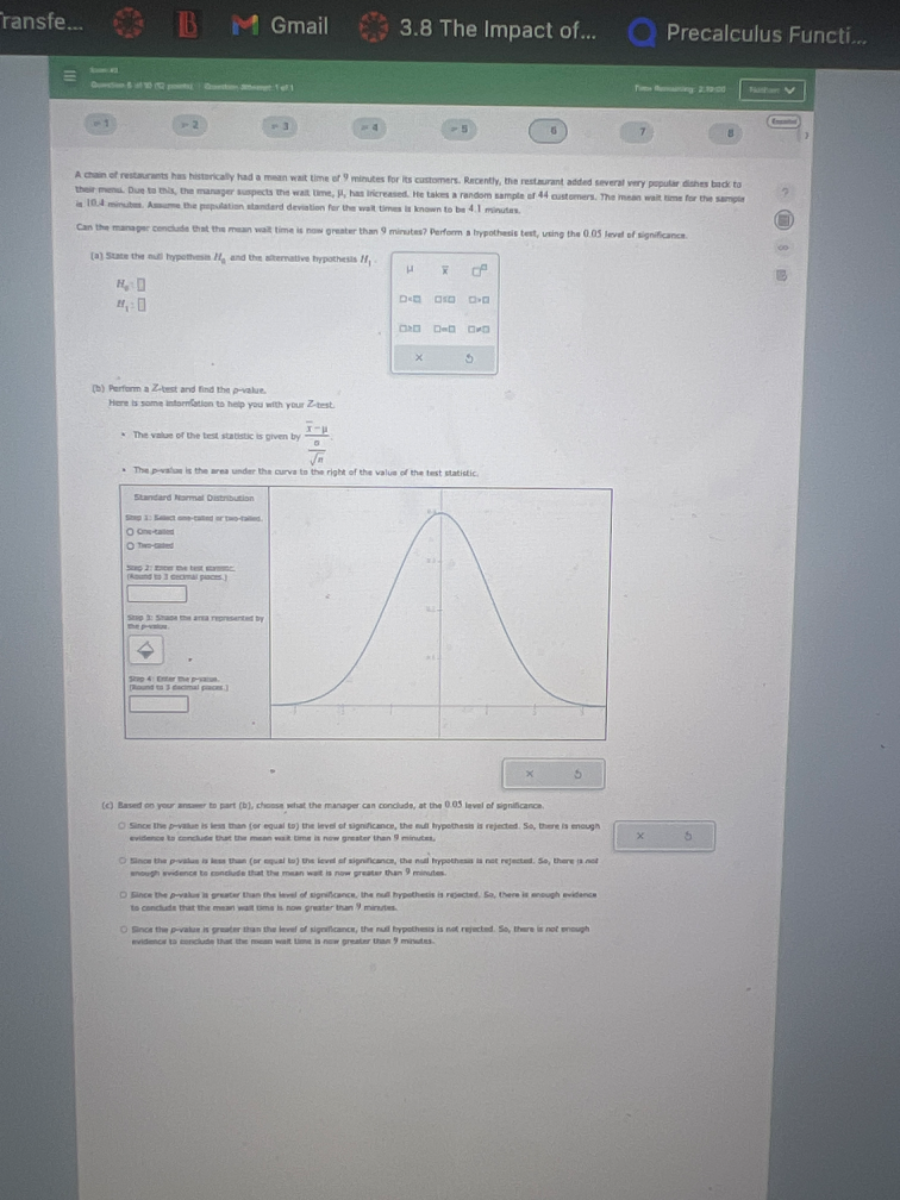
(a) State the null hypothesis \(H_0\) and the alternative hypothesis \(H_1\).
\(H_0:\ \)
\(H_1:\ \)
(b) Perform a Z-test and find the p-value.
Here is some information to help you with your Z-test.
\(�ullet\) The value of the test statistic is given by \(\displaystyle Z = �rac{\overline{x}-\mu}{\sigma/\sqrt{n}}\)
\(�ullet\) The p-value is the area under the curve to the right of the value of the test statistic.
\(�ullet\) <Standard Normal Distribution Table>
\(\mu=0,\sigma=1\)
Step 1: Compute the test statistic.
Step 2: Find the p-value.
Step 3: Shade the area represented by the p-value.
Step 4: Enter the p-value. (Round to 3 decimal places.)
(c) Based on your answer to part (b), choose what the manager can conclude, at the 0.01 level of significance.
\(\square\) Since the p-value is less than (or equal to) the level of significance, the null hypothesis is rejected. So, there is enough evidence to conclude that the mean wait time is now greater than 9 minutes.
\(\square\) Since the p-value is less than (or equal to) the level of significance, the null hypothesis is not rejected. So, there is not enough evidence to conclude that the mean wait time is now greater than 9 minutes.
\(\square\) Since the p-value is greater than the level of significance, the null hypothesis is rejected. So, there is enough evidence to conclude that the mean wait time is now greater than 9 minutes.
\(\square\) Since the p-value is greater than the level of significance, the null hypothesis is not rejected. So, there is not enough evidence to conclude that the mean wait time is now greater than 9 minutes.
<The image contains a bell curve with shaded areas and a Standard Normal Distribution table.>