Determine the area under the standard normal curve that lies to the left of
(a) Z=1.44, (b) Z=-0.28, (c) Z=-0.79, and (d) Z=-0.37.
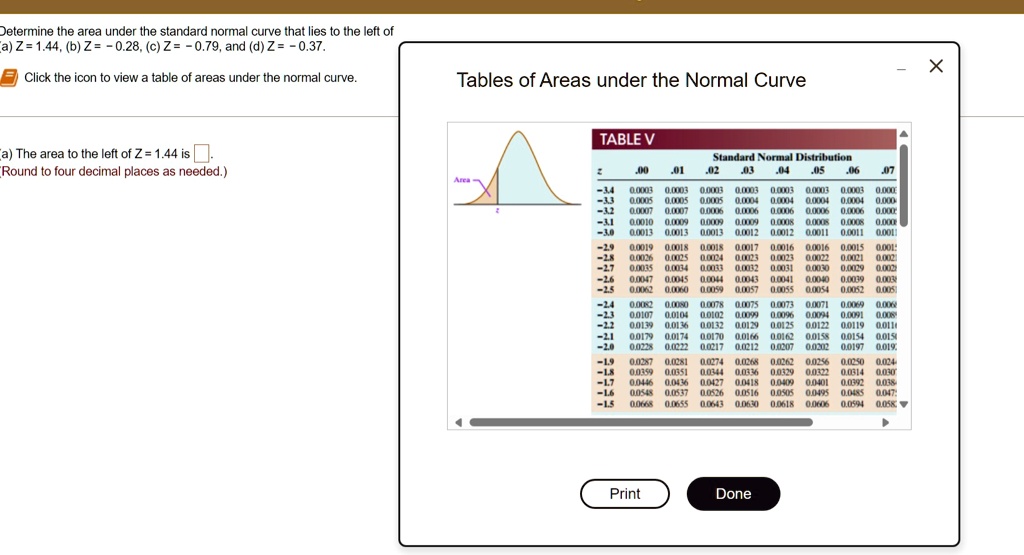
Click the icon to view a table of areas under the normal curve.
Tables of Areas under the Normal Curve
(a) The area to the left of Z=1.44 is
Round to four decimal places as needed.)
Determine the area under the standard normal curve that lies to the left of a) Z=1.44, (b) Z=-0.28, (c) Z=-0.79, and (d) Z=-0.37
Click the icon to view a table of areas under the normal curve
Tables of Areas under the Normal Curve
TABLE
The area to the left of Z=1.44 is Round to four decimal places as needed.)
Standard Normal Distribution
-3.4 -3.3 0.0003 0.0003 0.0003 0.0003 0.0003 0.0003 0.0003 0.0005 0.0005 0.0005 0.0004 0.0004 0.0004 0.0004 0.0007 0.0007 0.0006 0.0006 0.0006 0.0006 0.0006 0.0006 0.0010 0.0009 0.0009 0.0009 0.0008 0.0008 0.0008 0.0013 0.0013 0.0013 0.0012 0.0012 0.0011 0.0011 0.0019 0.0018 0.0018 0.0017 0.0016 0.0016 0.0015 0.0016 0.0026 0.0025 0.0024 0.0023 0.0023 0.0022 0.0021 0.0021 0.0035 0.0034 0.0033 0.0032 0.0031 0.0030 0.0029 0.0029 0.0047 0.0045 0.0044 0.0043 0.0040 0.0039 0.0039 0.0062 0.0060 0.0055 0.0057 0.0055 0.0054 0.0052 0.0051 0.0082 0.0080 0.0078 0.0075 0.0073 0.0071 0.0069 0.0069 0.0107 0.0102 0.0095 0.0096 0.0094 0.0080 0.0139 0.0136 0.0132 0.0129 0.0125 0.0122 0.0110 0.0174 0.0170 0.0166 0.0162 0.0158 0.0154 0.0151 0.0228 0.0222 0.0217 0.0212 0.0207 0.0202 0.0197 0.0197 0.0287 0.0281 0.0274 0.0268 0.0262 0.0256 0.0250 0.0250 0.0359 0.0351 0.0344 0.0336 0.0329 0.0322 0.0314 0.0314 0.0446 0.0436 0.0427 0.0418 0.0409 0.0401 0.0392 0.0392 0.0548 0.0537 0.0526 0.0516 0.0505 0.0495 0.0485 0.0485 0.0668 0.0655 0.0643 0.0630 0.0618 0.0606 0.0594 0.0594
-3.1 -3.0
-2.8 -2.7 -2.6 -2.5 -2.4 -2.3 -2.2 -2.1 -2.0
-1.9 -1.8 -1.7 -1.6 -1.5
Print
Done