Ahmad Reda

Cairo University
Teaching Assistant

Biography

I am Ahmad Reda, Structural Engineer and Teaching Assistant in Cairo University. Besides, I am a problem solving lover, I have passion exploring math stuff and its tips and tricks.

Education

MS Structural Engineering
Cairo University

Educator Statistics

Numerade tutor for 6 years
4833 Students Helped

Topics Covered

Exploring Probability Topics: From Basics to Advanced Strategies
Understanding the Normal Distribution: A Comprehensive Guide
Maximizing Accuracy with Effective Sampling and Data Analysis
Unlocking Insights with Descriptive Statistics: A Comprehensive Guide
Lines and Planes in Space
Polar Coordinates: Understanding the Basics and Applications
Unlock the Power of Vectors: Discover Their Limitless Possibilities
Master Trigonometry with Our Comprehensive Guide
Understanding Complex Numbers: A Comprehensive Guide
Mastering Integrals: Tips and Tricks for Calculus Success
Integration
Applications of Integration: Exploring Real-World Solutions
Unlock Insights with Data-Driven Graphs & Statistics
Discover the Wonders of Geometry: An Introduction to Shapes and Space
Mastering Matrices: An Introduction to the Fundamentals
Breaking Limits: Unlock Your Potential with Our Expert Solutions
Exploring the World of Derivatives: A Comprehensive Guide
Explore the Power of Continuous Functions: Boost Your Mathematical Skills
Stand Out with Differentiation Strategies | Boost Your Business
Applications of the Derivative
Mastering Partial Derivatives: Essential Techniques and Tips
Mastering Integration Techniques for Optimal Results
Mastering Multiple Integrals: Techniques and Tips
Linear Regression & Correlation: Analyzing Data Relationships
Understanding Discrete Random Variables: A Comprehensive Guide
Understanding Continuous Random Variables: Key Concepts
Discover the Power of Other Chi Square Tests | Boost Your Analysis
Understanding the Chi Square Distribution: Key Concepts & Applications
Unlocking the Power of Confidence Intervals: A Comprehensive Guide
Unlocking the Power of Chi Square Tests and the F Distribution
Hypothesis Testing with One Sample: A Comprehensive Guide
Unlocking the Power of Experimentation: A Guide to Success
Introduction to Combinatorics & Probability: Understanding the Basics
The Normal Distribution
Master Probability and Counting Rules for Better Outcomes
The Central Limit Theorem: Understanding Statistical Sampling
Understanding Discrete Probability Distributions: A Comprehensive Guide
Hypothesis Testing with Two Samples: A Comprehensive Guide
Mastering Sequences and Series: An Introduction
Maximizing Results with Distribution & One-Way ANOVA Analysis
Understanding Probability and Statistics: Key Concepts and Principles
Understanding Confidence Intervals and Sample Size
Mastering Fractions and Mixed Numbers: A Comprehensive Guide
Rational Numbers
Mastering Linear Equations and Inequalities: Essential Techniques
Introduction to Combinatorics and Probability
Solving Systems of Equations and Inequalities: A Comprehensive Guide
Mastering Equations and Inequalities: Your Guide to Mathematical Success
Mastering Exponential and Logarithmic Functions: Your Ultimate Guide
Mastering Polynomials: Essential Tips and Tricks | [Brand Name]
Understanding Equilibrium and Elasticity: A Comprehensive Guide

Ahmad's Textbook Answer Videos

04:58
Fundamentals of Differential Equations

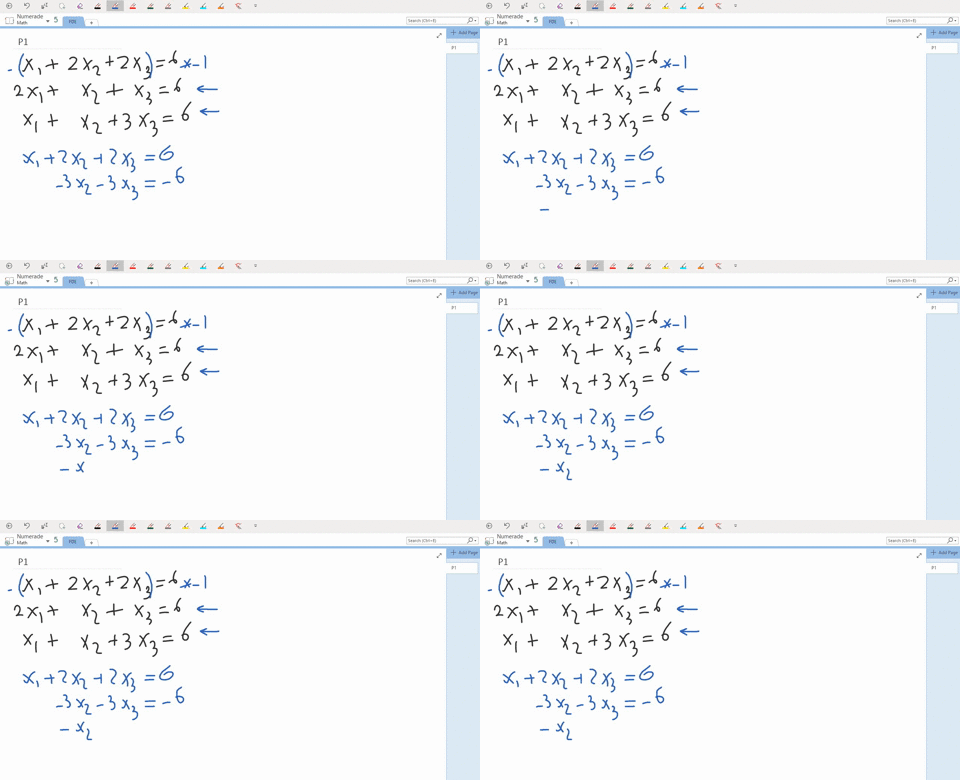
$\begin{aligned} x_{1}+2 x_{2}+2 x_{3} &=6 \\ 2 x_{1}+x_{2}+x_{3} &=6 \\ x_{1}+x_{2}+3 x_{3} &=6 \end{aligned}$

Chapter 9: Matrix Methods for Linear Systems
Section 2: Review 1: Linear Algebraic Equations
Ahmad Reda
02:52
Fundamentals of Differential Equations

$\begin{aligned} x_{1}+x_{2}-x_{3} &=0 \\-x_{1}-x_{2}+x_{3} &=0 \\ x_{1}+x_{2}-x_{3} &=0 \end{aligned}$

Chapter 9: Matrix Methods for Linear Systems
Section 2: Review 1: Linear Algebraic Equations
Ahmad Reda
01:16
Fundamentals of Differential Equations

$\begin{aligned}-x_{1}+2 x_{2} &=0 \\ 2 x_{1}+3 x_{2} &=0 \end{aligned}$

Chapter 9: Matrix Methods for Linear Systems
Section 2: Review 1: Linear Algebraic Equations
Ahmad Reda
02:08
Fundamentals of Differential Equations

$\begin{aligned}-x_{1}+3 x_{2} &=0 \\-3 x_{1}+9 x_{2} &=0 \end{aligned}$

Chapter 9: Matrix Methods for Linear Systems
Section 2: Review 1: Linear Algebraic Equations
Ahmad Reda
03:20
Fundamentals of Differential Equations

$\begin{aligned}(1-i) x_{1}+2 x_{2} &=0 \\-x_{1}-(1+i) x_{2} &=0 \end{aligned}$

Chapter 9: Matrix Methods for Linear Systems
Section 2: Review 1: Linear Algebraic Equations
Ahmad Reda
05:21
Fundamentals of Differential Equations

$\begin{aligned} 2 x_{1}+x_{3} &=-1 \\-3 x_{1}+x_{2}+4 x_{3} &=1 \\-x_{1}+x_{2}+5 x_{3} &=0 \end{aligned}$

Chapter 9: Matrix Methods for Linear Systems
Section 2: Review 1: Linear Algebraic Equations
Ahmad Reda
1 2 3 4 5 ... 415

Ahmad's Quick Ask Videos

05:58
Physics 101 Mechanics

A potter is shaping a bowl on a potter's wheel rotating at constant angular velocity of 1.4 rev/s (Figure 1). The friction force between her hands and the clay is 1.7 N total.

Ahmad Reda
05:57
Intro Stats / AP Statistics

Statistics Problem: DATA INTERPRETATION

Ahmad Reda
03:48
Intro Stats / AP Statistics

The length of time it takes to find a parking space at 9 AM college in normal distribution with the Mina five minutes on the standard deviation of two minutes on the probability that it takes not at least nine minutes to find a parking space

Ahmad Reda
03:01
Intro Stats / AP Statistics

As subway train on the redline arise every 10 minutes during rush hour we are interested in the length of time a commuter must wait for a chain to arrive the time follows a uniform distribution

Ahmad Reda
08:01
Intro Stats / AP Statistics

A random sample of 10 universities gave the following data on student-to-faculty ratio and
graduation rate.
S/F ratio Graduation rate S/F ratio Graduation rate
16 45 17 46
20 55 17 50
17 70 17 66
19 50 10 26
22 47 18 60
a) Find the line of best fit for this set of data. Show work.
b) Predict the graduation rate at a university with a student-to-faculty ratio of 16.

Ahmad Reda
03:36
Intro Stats / AP Statistics

A large international company with over 1.5 million employees wants to estimate how many of their employees have a cholesterol level that is higher than the recommended level. The company collects data from a random sample of employees and creates a 95% confidence interval for the population mean cholesterol level for all company employees.

The upper bound of a 95% confidence interval for the population mean cholesterol level was 260.73, and the width of the same 95% confidence interval was 10.92.

In this confidence interval, what is the sample mean (x bar) cholesterol level? Provide your answer as a number rounded to two decimal places.
Ahmad Reda
1 2 3 4 5 ... 350