Tutor at SuperProf
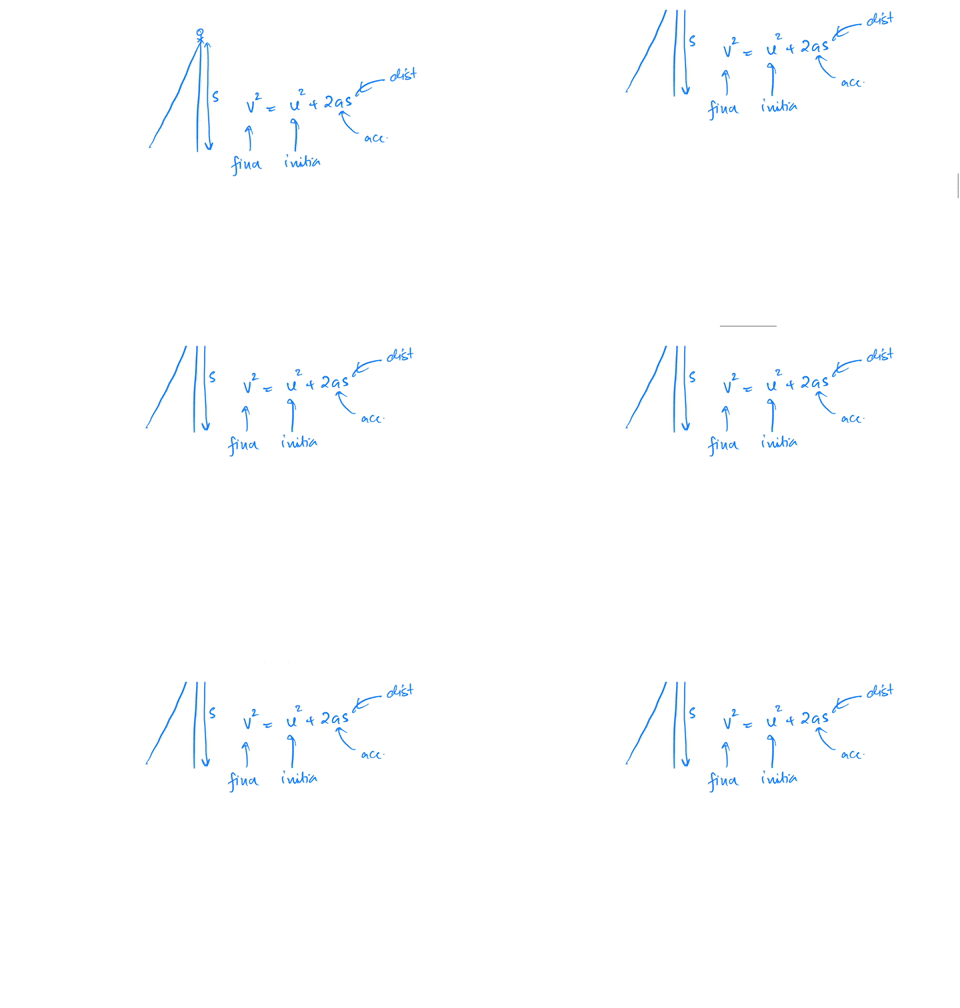
A stone was dropped off a cliff and hit the ground with a speed of $ 120\;ft/s $. What is the height of the cliff?
For each of the reactions listed, determine the mole ratio of reactants that produces the maximum amount of precipitate. Be sure to balance the equations.a. $\operatorname{AgNO}_{3}(a q)+\operatorname{NaCl}(a q) \longrightarrow \operatorname{AgCl}(s)+\operatorname{NaNO}_{3}(a q)$b. $\mathrm{Cu}\left(\mathrm{NO}_{3}\right)_{2}(a q)+\mathrm{K}_{2} \mathrm{CO}_{3}(a q) \longrightarrow \mathrm{CuCO}_{3}(s)+\mathrm{KNO}_{3}(a q)$c. $\mathrm{ZnCl}_{2}(a q)+\mathrm{NaOH}(a q) \longrightarrow \mathrm{Zn}(\mathrm{OH})_{2}(s)+\mathrm{NaCl}(a q)$d. $\mathrm{CaCl}_{2}(a q)+\mathrm{Na}_{2} \mathrm{C}_{2} \mathrm{O}_{4}(a q) \longrightarrow \mathrm{CaC}_{2} \mathrm{O}_{4}(s)+\mathrm{NaCl}(a q)$
Research the range of volumes used for packaging liquids sold in supermarkets.
To determine the volume of a cube, a student measured one of the dimensions of the cube several times. If the true dimension of the cube is 10.62 cm, give an example of four sets of measurements that would illustrate the following.a. imprecise and inaccurate datab. precise but inaccurate datac. precise and accurate dataGive a possible explanation as to why data can be imprecise or inaccurate. What is wrong with saying a set of measurements is imprecise but accurate?
In $\triangle A B C, m \angle A=53^{\circ}$ and $c=7 \mathrm{cm} .$ Find each value to the nearest tenth.Find $a$ for $b=11 \mathrm{cm}$
Major League Baseball now records information about every pitch thrown in every game of every season. Statistician Jim Albert compiled data about every pitch thrown by 20 starting pitchers during the 2009 MLB season. The data set included the type of pitch thrown (curveball, changeup, slider, etc.) as well as the speed of the ball as it left the pitcher's hand. A histogram of speeds for all 30,740 four-seam fastballs thrown by these pitchers during the 2009 season is shown below, from which we can see that the speeds of these fastballs follow a Normal model with mean μ = 92.12 mph and a standard deviation of σ = 2.43 mph.
1. Compute the z-score of a pitch with a speed of 87.3 mph. (Round your answer to two decimal places.) =2. Approximately what fraction of these four-seam fastballs would you expect to have speeds between 88.4 mph and 91.2 mph? (Express your answer as a decimal, not a percent, and round to three decimal places.) =3. Approximately what fraction of these four-seam fastballs would you expect to have speeds below 88.4 mph? (Express your answer as a decimal, not a percent, and round to three decimal places.) =4. A baseball fan wishes to identify the four-seam fastballs among the slowest 20% of all such pitches. Below what speed must a four-seam fastball be in order to be included in the slowest 20%? (Round your answer to the nearest 0.1 mph.) =
You have estimated a regression equation to predict attendance in baseball games: Attendance = -34138.9 + (-2952.51*bobbleheadY) + (9933.84*capY) + (982.90*shirtY) + (11688.83*fireworksY) + (5585.28*Fri_Sat_SunY) + (1530.61*temp) + (-9.75*temp*temp) + (1698.69*ClearY) + (3590.05*DayY) Where "Y" indicates that the dummy variable is coded as Yes = 1 (so capY indicates 1 when caps are offered, 0 when otherwise). All variables are significant, except bobbleheads and caps. From the data, you know that, on average: no bobbleheads or caps are given at games, shirts are given at games, and there are almost always fireworks. Based on this information, you need to predict attendance for a Sunday Day game. You check the weather and find that the weather is expected to be clear with a temperature of 80 deg F.
Q7. The team manager informs you that the permission for fireworks was denied. He wants to know if there will be any change in the attendance (from what you just calculated above). What do you tell him?
Attendance will increase by around 11688 peopleThere will be no change in attendanceAttendance will decrease by around 11688 peopleAttendance will decrease by around 22450 people
3.16 Does echinacea reduce the severity of the common cold? In astudydesigned to evaluate the benefits of taking echinacea when you havea cold, 719 patients were randomlydivided into four groups. The groups were (1) no pills, (2)pills that had no echinacea, (3) pills that hadechinacea but the subjects did not know whether or not the pillscontained echinacea, and (4) pills thathad echinacea and the bottle containing the pills stated that thecontents included echinacea. Theoutcome was a measure of the severity of the cold.(a) Identify the type of data collected in this study. Givereasons for your answer.(b) Is this an experiment? If yes, what is the treatment?
In a survey 163 of 388 administrative professionals respondedthat verbal recognition is the most preferred form of recognition,and 74 responded that cash bonuses are most preferred.a. Construct a 95% confidence interval estimate for the populationproportion of administrative professionals who prefer verbalrecognition.b. Construct a 95% confidence interval estimate for the populationproportion of administrative professionals who prefer cashbonuses.c. Interpret the intervals in (a) and (b).d. Explain the difference in the results in (a) and (b).
What positive qualities did Franklin have as a scientist that both Watson and Crick seemed to lack? What qualities did Watson and Crick have that Franklin lacked? Do you think Watson and Crick would ever have solved the structure of DNA without Franklin's data? Please answer in paragraphs.
The following data are from a completely randomized design.TreatmentABC162144126142156122167127131144144143146134152175153130Sample mean156143134Sample variance191.6121.6127.6Compute the sum of squares between treatments. Round theintermediate calculations to whole number.Compute the mean square between treatments.Compute the sum of squares due to error.Compute the mean square due to error (to 1 decimal).Set up the ANOVA table for this problem. Round all Sum ofSquares to nearest whole numbers. Round all Mean Squares to onedecimal places. Round F to two decimalplaces.Source of VariationSum of SquaresDegrees of FreedomMean SquareFTreatmentsErrorTotalAt the = .05 level of significance, test whether themeans for the three treatments are equal.The p-value is: less than .01, between .01 and .025,between .025 and .05, between .05 and .10, greater than.10 What is your conclusion?Conclude that not all treatment means are equal, Do not rejectthe assumption that the means for all three treatments areequal